Tlingit-Haida vs Trinidadian and Tobagonian Median Household Income
COMPARE
Tlingit-Haida
Trinidadian and Tobagonian
Median Household Income
Median Household Income Comparison
Tlingit-Haida
Trinidadians and Tobagonians
$83,968
MEDIAN HOUSEHOLD INCOME
32.6/ 100
METRIC RATING
188th/ 347
METRIC RANK
$80,402
MEDIAN HOUSEHOLD INCOME
4.7/ 100
METRIC RATING
231st/ 347
METRIC RANK
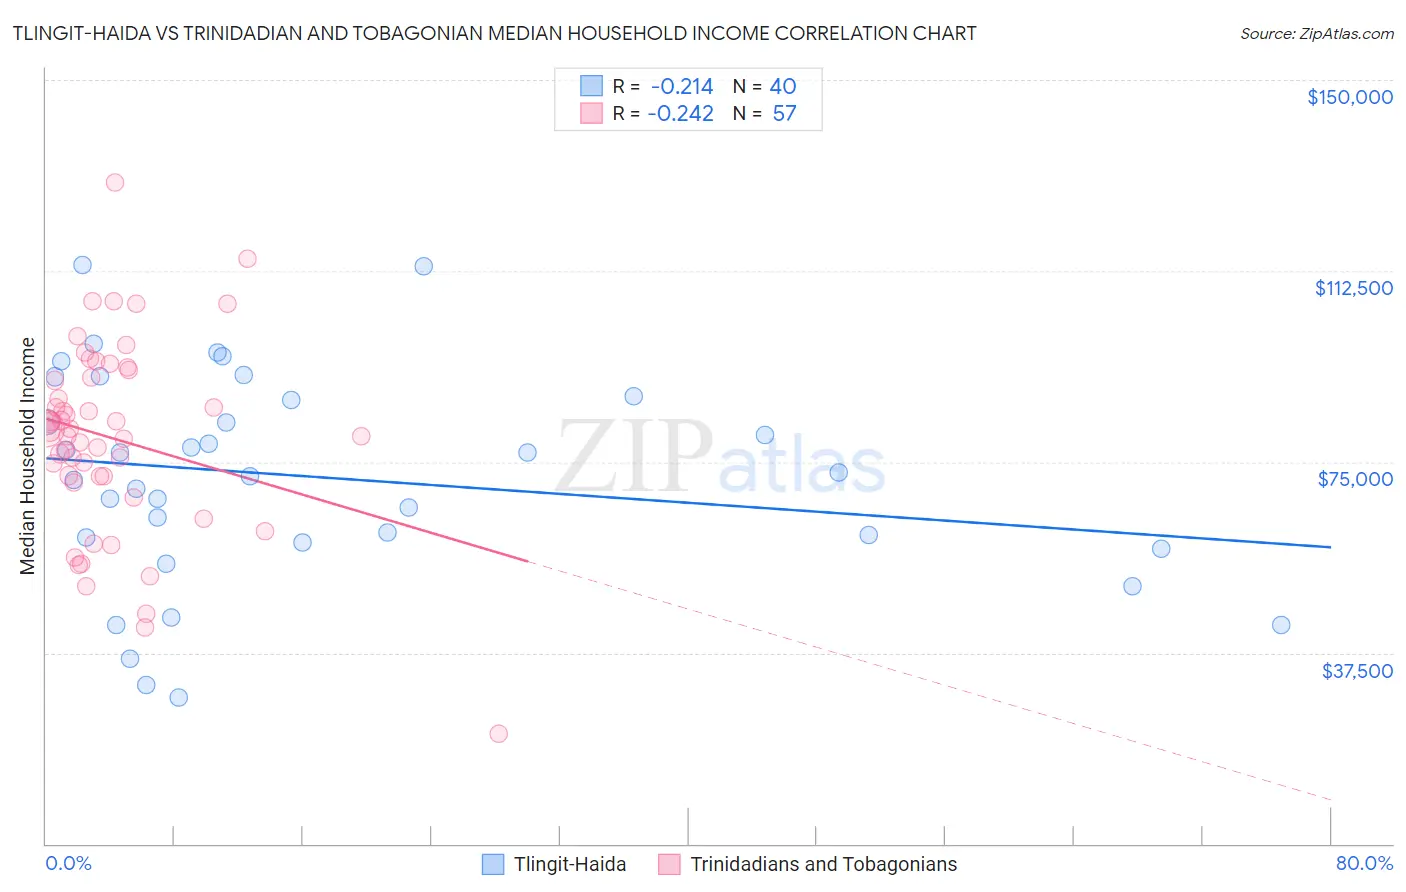
Tlingit-Haida vs Trinidadian and Tobagonian Median Household Income Correlation Chart
The statistical analysis conducted on geographies consisting of 60,854,436 people shows a weak negative correlation between the proportion of Tlingit-Haida and median household income in the United States with a correlation coefficient (R) of -0.214 and weighted average of $83,968. Similarly, the statistical analysis conducted on geographies consisting of 219,662,857 people shows a weak negative correlation between the proportion of Trinidadians and Tobagonians and median household income in the United States with a correlation coefficient (R) of -0.242 and weighted average of $80,402, a difference of 4.4%.
Median Household Income Correlation Summary
| Measurement | Tlingit-Haida | Trinidadian and Tobagonian |
| Minimum | $28,750 | $21,629 |
| Maximum | $113,574 | $129,829 |
| Range | $84,824 | $108,200 |
| Mean | $71,962 | $79,550 |
| Median | $72,542 | $80,957 |
| Interquartile 25% (IQ1) | $59,644 | $71,474 |
| Interquartile 75% (IQ3) | $87,562 | $92,337 |
| Interquartile Range (IQR) | $27,918 | $20,862 |
| Standard Deviation (Sample) | $20,793 | $19,105 |
| Standard Deviation (Population) | $20,531 | $18,937 |
Similar Demographics by Median Household Income
Demographics Similar to Tlingit-Haida by Median Household Income
In terms of median household income, the demographic groups most similar to Tlingit-Haida are Puget Sound Salish ($84,011, a difference of 0.050%), Belgian ($84,008, a difference of 0.050%), Immigrants from Colombia ($83,902, a difference of 0.080%), Kenyan ($84,085, a difference of 0.14%), and Slovak ($83,798, a difference of 0.20%).
| Demographics | Rating | Rank | Median Household Income |
| Hawaiians | 44.1 /100 | #181 | Average $84,729 |
| Uruguayans | 43.5 /100 | #182 | Average $84,691 |
| Spaniards | 42.7 /100 | #183 | Average $84,644 |
| Immigrants | Eastern Africa | 37.4 /100 | #184 | Fair $84,299 |
| Kenyans | 34.2 /100 | #185 | Fair $84,085 |
| Puget Sound Salish | 33.2 /100 | #186 | Fair $84,011 |
| Belgians | 33.2 /100 | #187 | Fair $84,008 |
| Tlingit-Haida | 32.6 /100 | #188 | Fair $83,968 |
| Immigrants | Colombia | 31.7 /100 | #189 | Fair $83,902 |
| Slovaks | 30.2 /100 | #190 | Fair $83,798 |
| Iraqis | 29.6 /100 | #191 | Fair $83,753 |
| Welsh | 28.0 /100 | #192 | Fair $83,628 |
| Finns | 27.7 /100 | #193 | Fair $83,607 |
| Ghanaians | 27.4 /100 | #194 | Fair $83,582 |
| Immigrants | Armenia | 27.0 /100 | #195 | Fair $83,555 |
Demographics Similar to Trinidadians and Tobagonians by Median Household Income
In terms of median household income, the demographic groups most similar to Trinidadians and Tobagonians are Bermudan ($80,406, a difference of 0.010%), Immigrants from Trinidad and Tobago ($80,373, a difference of 0.040%), Immigrants from the Azores ($80,357, a difference of 0.060%), Immigrants from Ecuador ($80,341, a difference of 0.080%), and Immigrants from Guyana ($80,324, a difference of 0.10%).
| Demographics | Rating | Rank | Median Household Income |
| Malaysians | 7.0 /100 | #224 | Tragic $81,064 |
| Scotch-Irish | 6.6 /100 | #225 | Tragic $80,972 |
| Immigrants | Panama | 6.2 /100 | #226 | Tragic $80,873 |
| Guyanese | 5.7 /100 | #227 | Tragic $80,734 |
| Immigrants | Bangladesh | 5.7 /100 | #228 | Tragic $80,722 |
| Delaware | 5.0 /100 | #229 | Tragic $80,527 |
| Bermudans | 4.7 /100 | #230 | Tragic $80,406 |
| Trinidadians and Tobagonians | 4.7 /100 | #231 | Tragic $80,402 |
| Immigrants | Trinidad and Tobago | 4.6 /100 | #232 | Tragic $80,373 |
| Immigrants | Azores | 4.5 /100 | #233 | Tragic $80,357 |
| Immigrants | Ecuador | 4.5 /100 | #234 | Tragic $80,341 |
| Immigrants | Guyana | 4.5 /100 | #235 | Tragic $80,324 |
| Immigrants | Bosnia and Herzegovina | 3.4 /100 | #236 | Tragic $79,888 |
| Nicaraguans | 3.1 /100 | #237 | Tragic $79,737 |
| Barbadians | 3.0 /100 | #238 | Tragic $79,664 |