Tlingit-Haida vs Immigrants from Fiji Median Family Income
COMPARE
Tlingit-Haida
Immigrants from Fiji
Median Family Income
Median Family Income Comparison
Tlingit-Haida
Immigrants from Fiji
$101,092
MEDIAN FAMILY INCOME
30.8/ 100
METRIC RATING
187th/ 347
METRIC RANK
$106,544
MEDIAN FAMILY INCOME
87.8/ 100
METRIC RATING
132nd/ 347
METRIC RANK
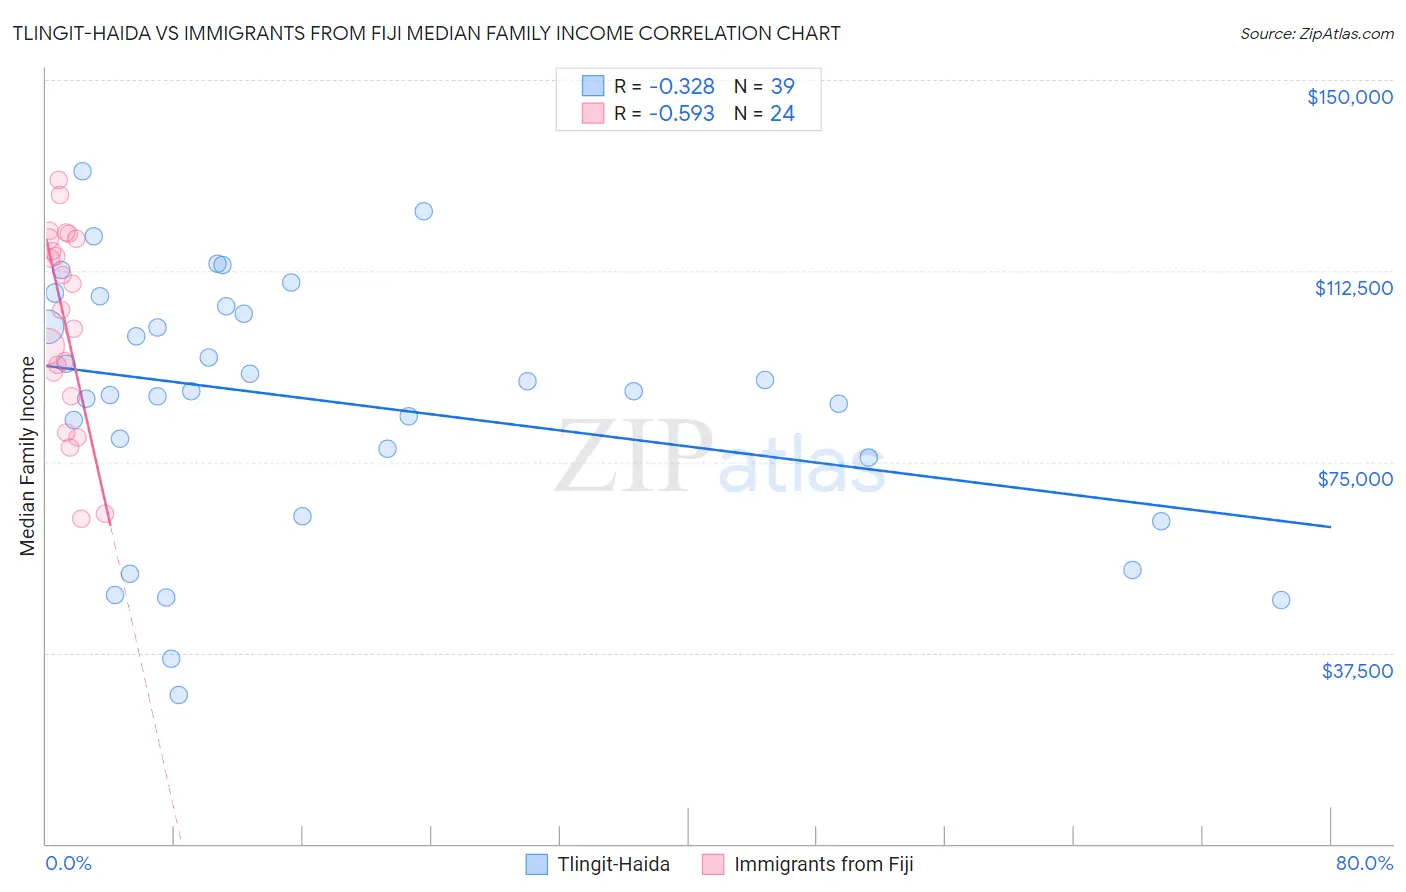
Tlingit-Haida vs Immigrants from Fiji Median Family Income Correlation Chart
The statistical analysis conducted on geographies consisting of 60,853,273 people shows a mild negative correlation between the proportion of Tlingit-Haida and median family income in the United States with a correlation coefficient (R) of -0.328 and weighted average of $101,092. Similarly, the statistical analysis conducted on geographies consisting of 93,753,108 people shows a substantial negative correlation between the proportion of Immigrants from Fiji and median family income in the United States with a correlation coefficient (R) of -0.593 and weighted average of $106,544, a difference of 5.4%.
Median Family Income Correlation Summary
| Measurement | Tlingit-Haida | Immigrants from Fiji |
| Minimum | $29,250 | $63,924 |
| Maximum | $132,184 | $130,465 |
| Range | $102,934 | $66,540 |
| Mean | $86,951 | $102,660 |
| Median | $88,958 | $107,335 |
| Interquartile 25% (IQ1) | $75,972 | $90,188 |
| Interquartile 75% (IQ3) | $105,493 | $118,761 |
| Interquartile Range (IQR) | $29,521 | $28,573 |
| Standard Deviation (Sample) | $24,804 | $19,212 |
| Standard Deviation (Population) | $24,484 | $18,807 |
Similar Demographics by Median Family Income
Demographics Similar to Tlingit-Haida by Median Family Income
In terms of median family income, the demographic groups most similar to Tlingit-Haida are Guamanian/Chamorro ($101,061, a difference of 0.030%), Celtic ($101,139, a difference of 0.050%), Dutch ($101,192, a difference of 0.10%), Immigrants from Portugal ($100,984, a difference of 0.11%), and Immigrants ($100,962, a difference of 0.13%).
| Demographics | Rating | Rank | Median Family Income |
| French Canadians | 37.0 /100 | #180 | Fair $101,634 |
| Spaniards | 36.8 /100 | #181 | Fair $101,617 |
| Tsimshian | 35.9 /100 | #182 | Fair $101,543 |
| Kenyans | 34.5 /100 | #183 | Fair $101,417 |
| Immigrants | Costa Rica | 33.7 /100 | #184 | Fair $101,354 |
| Dutch | 31.9 /100 | #185 | Fair $101,192 |
| Celtics | 31.3 /100 | #186 | Fair $101,139 |
| Tlingit-Haida | 30.8 /100 | #187 | Fair $101,092 |
| Guamanians/Chamorros | 30.5 /100 | #188 | Fair $101,061 |
| Immigrants | Portugal | 29.6 /100 | #189 | Fair $100,984 |
| Immigrants | Immigrants | 29.4 /100 | #190 | Fair $100,962 |
| Colombians | 27.2 /100 | #191 | Fair $100,750 |
| Immigrants | Kenya | 26.5 /100 | #192 | Fair $100,679 |
| Iraqis | 26.3 /100 | #193 | Fair $100,658 |
| Uruguayans | 26.3 /100 | #194 | Fair $100,656 |
Demographics Similar to Immigrants from Fiji by Median Family Income
In terms of median family income, the demographic groups most similar to Immigrants from Fiji are Ugandan ($106,541, a difference of 0.0%), Canadian ($106,597, a difference of 0.050%), Immigrants from Oceania ($106,453, a difference of 0.090%), Portuguese ($106,286, a difference of 0.24%), and Immigrants from South Eastern Asia ($106,252, a difference of 0.27%).
| Demographics | Rating | Rank | Median Family Income |
| Taiwanese | 91.4 /100 | #125 | Exceptional $107,295 |
| Serbians | 90.8 /100 | #126 | Exceptional $107,157 |
| Lebanese | 90.5 /100 | #127 | Exceptional $107,086 |
| Immigrants | Ethiopia | 90.0 /100 | #128 | Excellent $106,969 |
| Arabs | 89.9 /100 | #129 | Excellent $106,952 |
| Brazilians | 89.8 /100 | #130 | Excellent $106,942 |
| Canadians | 88.1 /100 | #131 | Excellent $106,597 |
| Immigrants | Fiji | 87.8 /100 | #132 | Excellent $106,544 |
| Ugandans | 87.8 /100 | #133 | Excellent $106,541 |
| Immigrants | Oceania | 87.3 /100 | #134 | Excellent $106,453 |
| Portuguese | 86.3 /100 | #135 | Excellent $106,286 |
| Immigrants | South Eastern Asia | 86.1 /100 | #136 | Excellent $106,252 |
| Immigrants | Uganda | 85.7 /100 | #137 | Excellent $106,188 |
| Immigrants | Vietnam | 85.7 /100 | #138 | Excellent $106,186 |
| Luxembourgers | 85.7 /100 | #139 | Excellent $106,183 |