Tlingit-Haida vs Guamanian/Chamorro Median Family Income
COMPARE
Tlingit-Haida
Guamanian/Chamorro
Median Family Income
Median Family Income Comparison
Tlingit-Haida
Guamanians/Chamorros
$101,092
MEDIAN FAMILY INCOME
30.8/ 100
METRIC RATING
187th/ 347
METRIC RANK
$101,061
MEDIAN FAMILY INCOME
30.5/ 100
METRIC RATING
188th/ 347
METRIC RANK
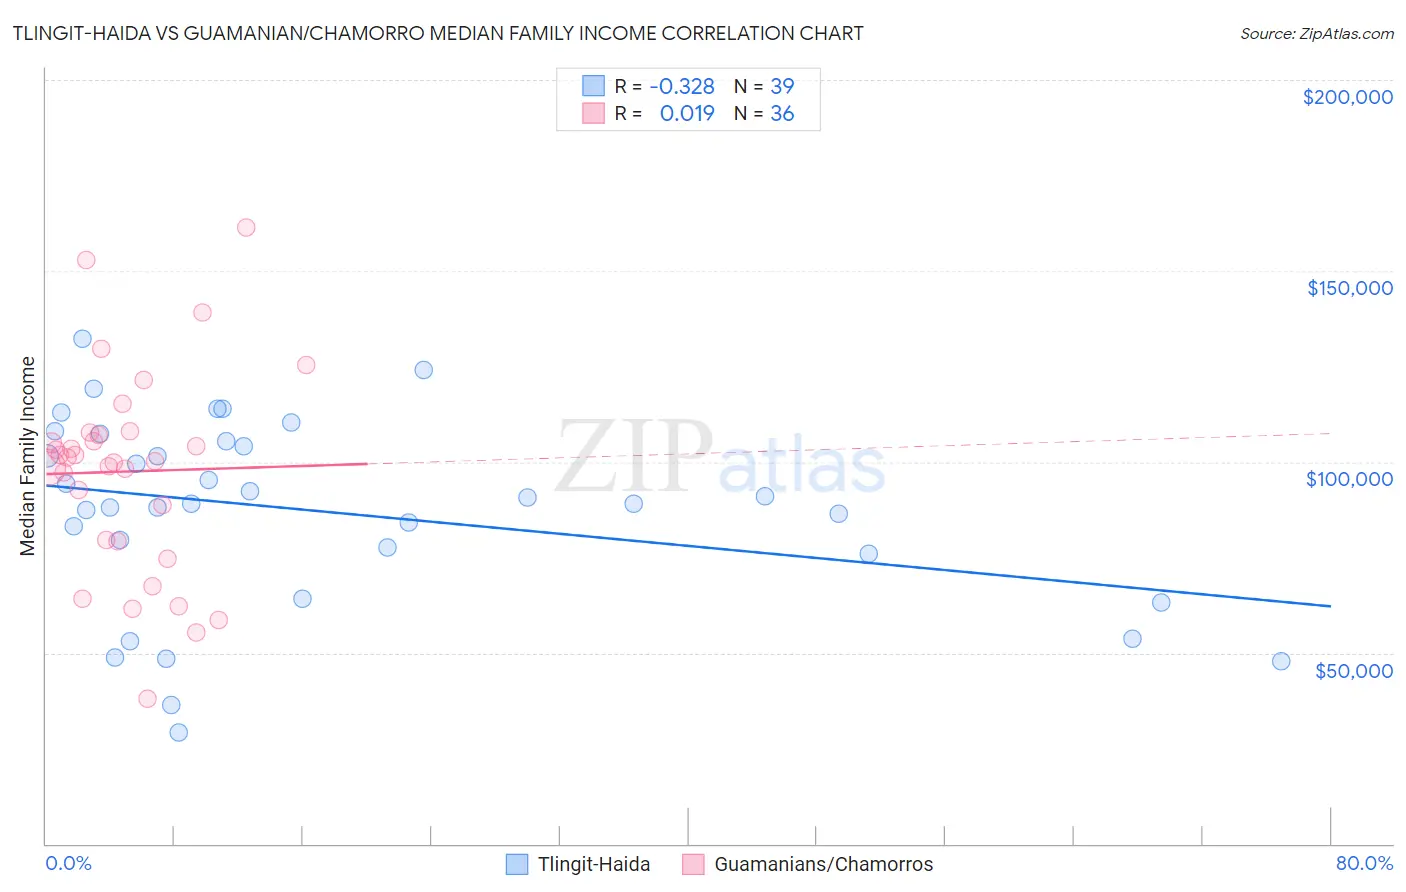
Tlingit-Haida vs Guamanian/Chamorro Median Family Income Correlation Chart
The statistical analysis conducted on geographies consisting of 60,853,273 people shows a mild negative correlation between the proportion of Tlingit-Haida and median family income in the United States with a correlation coefficient (R) of -0.328 and weighted average of $101,092. Similarly, the statistical analysis conducted on geographies consisting of 221,859,912 people shows no correlation between the proportion of Guamanians/Chamorros and median family income in the United States with a correlation coefficient (R) of 0.019 and weighted average of $101,061, a difference of 0.030%.
Median Family Income Correlation Summary
| Measurement | Tlingit-Haida | Guamanian/Chamorro |
| Minimum | $29,250 | $37,991 |
| Maximum | $132,184 | $161,250 |
| Range | $102,934 | $123,259 |
| Mean | $86,951 | $97,460 |
| Median | $88,958 | $100,672 |
| Interquartile 25% (IQ1) | $75,972 | $79,398 |
| Interquartile 75% (IQ3) | $105,493 | $107,355 |
| Interquartile Range (IQR) | $29,521 | $27,957 |
| Standard Deviation (Sample) | $24,804 | $26,595 |
| Standard Deviation (Population) | $24,484 | $26,223 |
Demographics Similar to Tlingit-Haida and Guamanians/Chamorros by Median Family Income
In terms of median family income, the demographic groups most similar to Tlingit-Haida are Celtic ($101,139, a difference of 0.050%), Dutch ($101,192, a difference of 0.10%), Immigrants from Portugal ($100,984, a difference of 0.11%), Immigrants ($100,962, a difference of 0.13%), and Immigrants from Costa Rica ($101,354, a difference of 0.26%). Similarly, the demographic groups most similar to Guamanians/Chamorros are Celtic ($101,139, a difference of 0.080%), Immigrants from Portugal ($100,984, a difference of 0.080%), Immigrants ($100,962, a difference of 0.10%), Dutch ($101,192, a difference of 0.13%), and Immigrants from Costa Rica ($101,354, a difference of 0.29%).
| Demographics | Rating | Rank | Median Family Income |
| Germans | 44.6 /100 | #177 | Average $102,254 |
| Welsh | 43.3 /100 | #178 | Average $102,151 |
| South Americans | 39.7 /100 | #179 | Fair $101,856 |
| French Canadians | 37.0 /100 | #180 | Fair $101,634 |
| Spaniards | 36.8 /100 | #181 | Fair $101,617 |
| Tsimshian | 35.9 /100 | #182 | Fair $101,543 |
| Kenyans | 34.5 /100 | #183 | Fair $101,417 |
| Immigrants | Costa Rica | 33.7 /100 | #184 | Fair $101,354 |
| Dutch | 31.9 /100 | #185 | Fair $101,192 |
| Celtics | 31.3 /100 | #186 | Fair $101,139 |
| Tlingit-Haida | 30.8 /100 | #187 | Fair $101,092 |
| Guamanians/Chamorros | 30.5 /100 | #188 | Fair $101,061 |
| Immigrants | Portugal | 29.6 /100 | #189 | Fair $100,984 |
| Immigrants | Immigrants | 29.4 /100 | #190 | Fair $100,962 |
| Colombians | 27.2 /100 | #191 | Fair $100,750 |
| Immigrants | Kenya | 26.5 /100 | #192 | Fair $100,679 |
| Iraqis | 26.3 /100 | #193 | Fair $100,658 |
| Uruguayans | 26.3 /100 | #194 | Fair $100,656 |
| Immigrants | South America | 23.9 /100 | #195 | Fair $100,414 |
| Samoans | 23.3 /100 | #196 | Fair $100,344 |
| Immigrants | Cameroon | 22.8 /100 | #197 | Fair $100,289 |