Tlingit-Haida vs Hawaiian Median Family Income
COMPARE
Tlingit-Haida
Hawaiian
Median Family Income
Median Family Income Comparison
Tlingit-Haida
Hawaiians
$101,092
MEDIAN FAMILY INCOME
30.8/ 100
METRIC RATING
187th/ 347
METRIC RANK
$98,869
MEDIAN FAMILY INCOME
12.5/ 100
METRIC RATING
205th/ 347
METRIC RANK
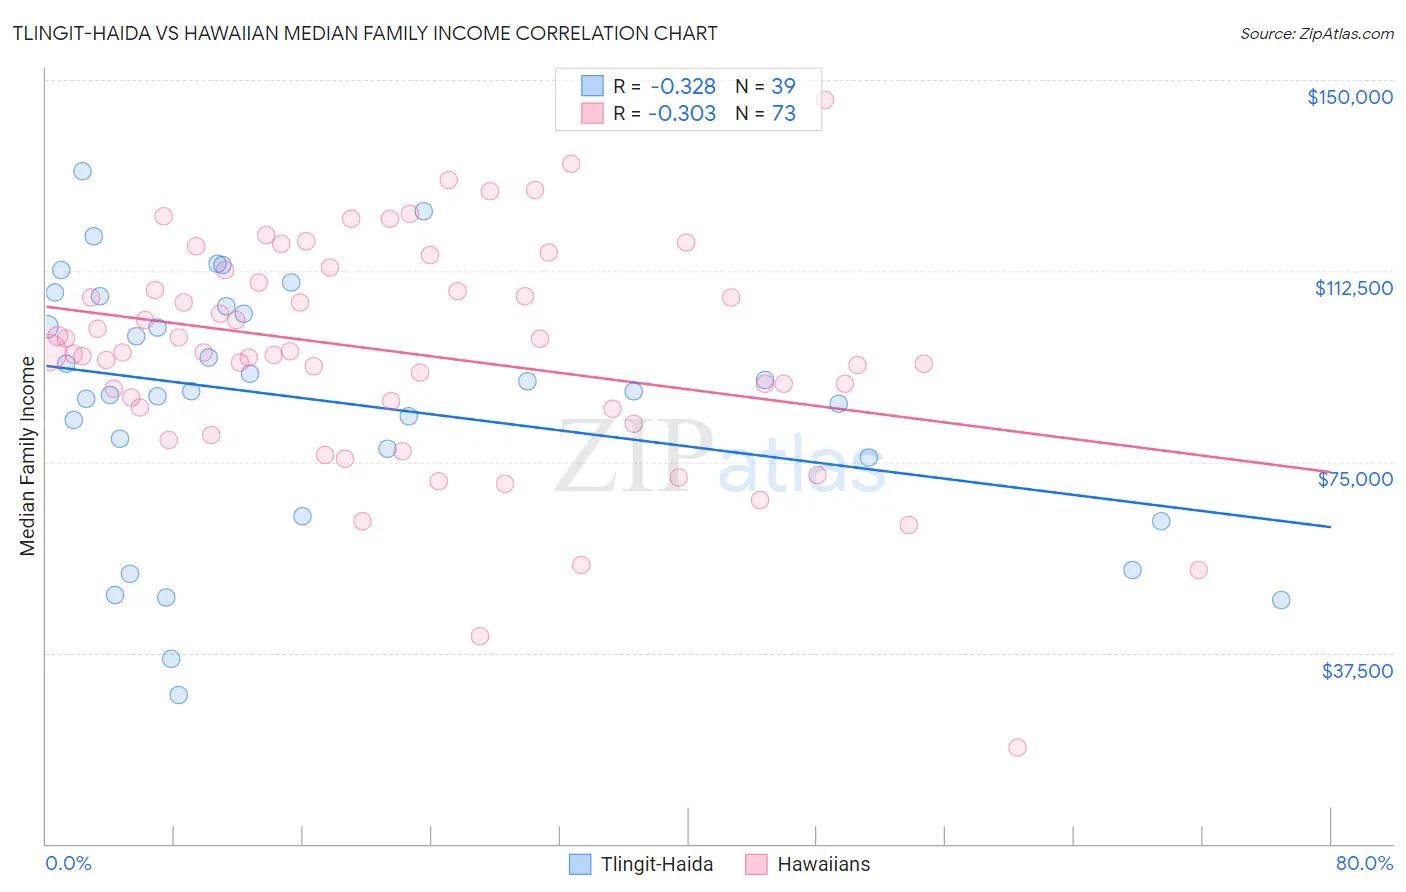
Tlingit-Haida vs Hawaiian Median Family Income Correlation Chart
The statistical analysis conducted on geographies consisting of 60,853,273 people shows a mild negative correlation between the proportion of Tlingit-Haida and median family income in the United States with a correlation coefficient (R) of -0.328 and weighted average of $101,092. Similarly, the statistical analysis conducted on geographies consisting of 327,312,132 people shows a mild negative correlation between the proportion of Hawaiians and median family income in the United States with a correlation coefficient (R) of -0.303 and weighted average of $98,869, a difference of 2.2%.
Median Family Income Correlation Summary
| Measurement | Tlingit-Haida | Hawaiian |
| Minimum | $29,250 | $18,796 |
| Maximum | $132,184 | $146,000 |
| Range | $102,934 | $127,204 |
| Mean | $86,951 | $96,414 |
| Median | $88,958 | $96,571 |
| Interquartile 25% (IQ1) | $75,972 | $85,564 |
| Interquartile 75% (IQ3) | $105,493 | $111,384 |
| Interquartile Range (IQR) | $29,521 | $25,820 |
| Standard Deviation (Sample) | $24,804 | $22,234 |
| Standard Deviation (Population) | $24,484 | $22,081 |
Demographics Similar to Tlingit-Haida and Hawaiians by Median Family Income
In terms of median family income, the demographic groups most similar to Tlingit-Haida are Guamanian/Chamorro ($101,061, a difference of 0.030%), Celtic ($101,139, a difference of 0.050%), Immigrants from Portugal ($100,984, a difference of 0.11%), Immigrants ($100,962, a difference of 0.13%), and Colombian ($100,750, a difference of 0.34%). Similarly, the demographic groups most similar to Hawaiians are Ghanaian ($98,877, a difference of 0.010%), Immigrants from Iraq ($98,786, a difference of 0.080%), Scotch-Irish ($99,591, a difference of 0.73%), White/Caucasian ($99,800, a difference of 0.94%), and Immigrants from Thailand ($99,840, a difference of 0.98%).
| Demographics | Rating | Rank | Median Family Income |
| Celtics | 31.3 /100 | #186 | Fair $101,139 |
| Tlingit-Haida | 30.8 /100 | #187 | Fair $101,092 |
| Guamanians/Chamorros | 30.5 /100 | #188 | Fair $101,061 |
| Immigrants | Portugal | 29.6 /100 | #189 | Fair $100,984 |
| Immigrants | Immigrants | 29.4 /100 | #190 | Fair $100,962 |
| Colombians | 27.2 /100 | #191 | Fair $100,750 |
| Immigrants | Kenya | 26.5 /100 | #192 | Fair $100,679 |
| Iraqis | 26.3 /100 | #193 | Fair $100,658 |
| Uruguayans | 26.3 /100 | #194 | Fair $100,656 |
| Immigrants | South America | 23.9 /100 | #195 | Fair $100,414 |
| Samoans | 23.3 /100 | #196 | Fair $100,344 |
| Immigrants | Cameroon | 22.8 /100 | #197 | Fair $100,289 |
| Immigrants | Africa | 22.5 /100 | #198 | Fair $100,256 |
| Yugoslavians | 21.3 /100 | #199 | Fair $100,119 |
| Spanish | 20.1 /100 | #200 | Fair $99,977 |
| Immigrants | Thailand | 19.0 /100 | #201 | Poor $99,840 |
| Whites/Caucasians | 18.7 /100 | #202 | Poor $99,800 |
| Scotch-Irish | 17.1 /100 | #203 | Poor $99,591 |
| Ghanaians | 12.6 /100 | #204 | Poor $98,877 |
| Hawaiians | 12.5 /100 | #205 | Poor $98,869 |
| Immigrants | Iraq | 12.1 /100 | #206 | Poor $98,786 |