Tlingit-Haida vs Arapaho Median Family Income
COMPARE
Tlingit-Haida
Arapaho
Median Family Income
Median Family Income Comparison
Tlingit-Haida
Arapaho
$101,092
MEDIAN FAMILY INCOME
30.8/ 100
METRIC RATING
187th/ 347
METRIC RANK
$82,064
MEDIAN FAMILY INCOME
0.0/ 100
METRIC RATING
327th/ 347
METRIC RANK
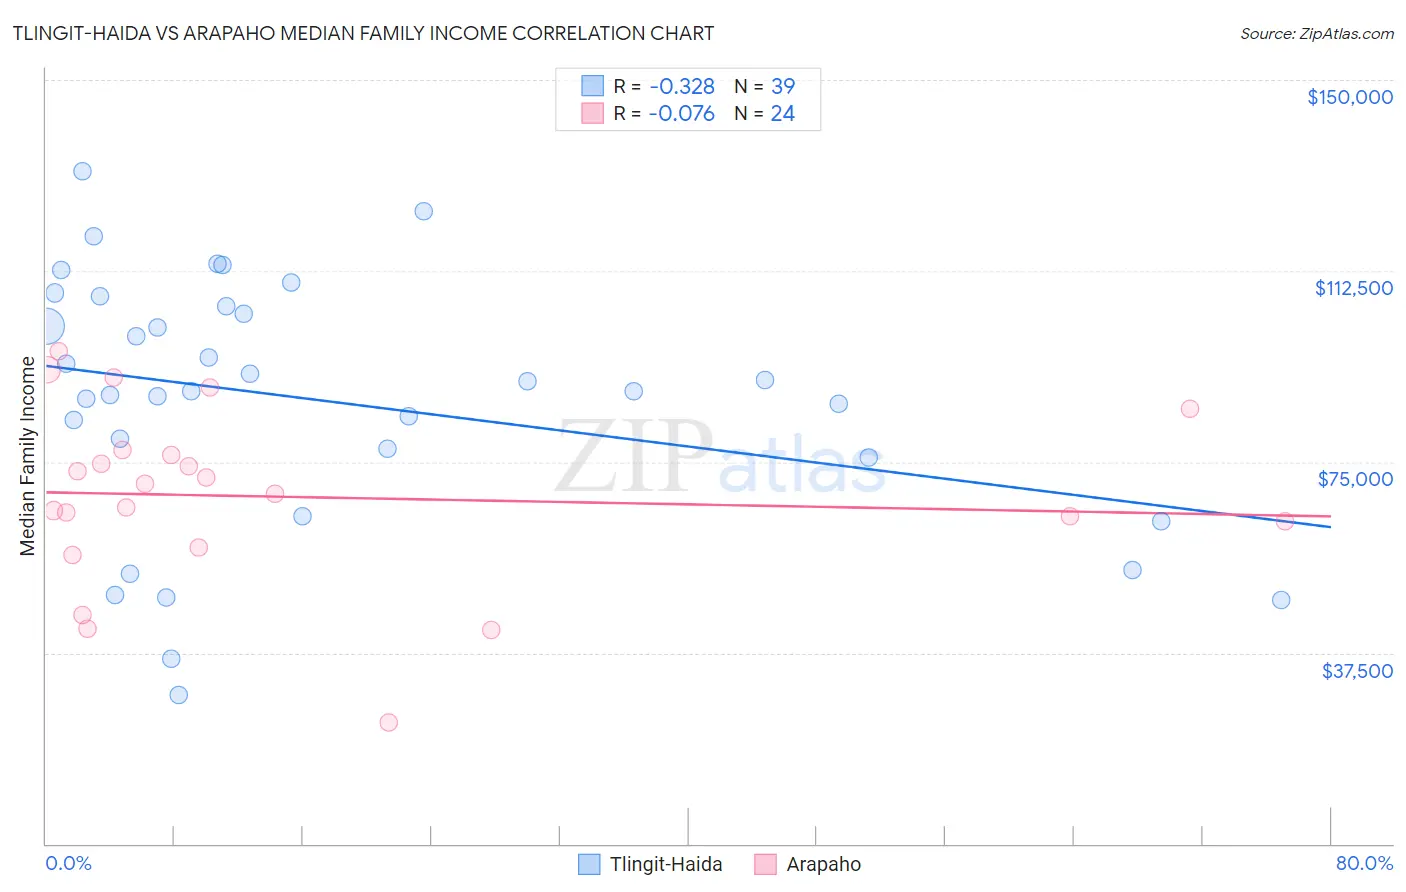
Tlingit-Haida vs Arapaho Median Family Income Correlation Chart
The statistical analysis conducted on geographies consisting of 60,853,273 people shows a mild negative correlation between the proportion of Tlingit-Haida and median family income in the United States with a correlation coefficient (R) of -0.328 and weighted average of $101,092. Similarly, the statistical analysis conducted on geographies consisting of 29,776,303 people shows a slight negative correlation between the proportion of Arapaho and median family income in the United States with a correlation coefficient (R) of -0.076 and weighted average of $82,064, a difference of 23.2%.
Median Family Income Correlation Summary
| Measurement | Tlingit-Haida | Arapaho |
| Minimum | $29,250 | $23,750 |
| Maximum | $132,184 | $96,782 |
| Range | $102,934 | $73,032 |
| Mean | $86,951 | $68,152 |
| Median | $88,958 | $69,777 |
| Interquartile 25% (IQ1) | $75,972 | $60,858 |
| Interquartile 75% (IQ3) | $105,493 | $76,786 |
| Interquartile Range (IQR) | $29,521 | $15,928 |
| Standard Deviation (Sample) | $24,804 | $17,667 |
| Standard Deviation (Population) | $24,484 | $17,295 |
Similar Demographics by Median Family Income
Demographics Similar to Tlingit-Haida by Median Family Income
In terms of median family income, the demographic groups most similar to Tlingit-Haida are Guamanian/Chamorro ($101,061, a difference of 0.030%), Celtic ($101,139, a difference of 0.050%), Dutch ($101,192, a difference of 0.10%), Immigrants from Portugal ($100,984, a difference of 0.11%), and Immigrants ($100,962, a difference of 0.13%).
| Demographics | Rating | Rank | Median Family Income |
| French Canadians | 37.0 /100 | #180 | Fair $101,634 |
| Spaniards | 36.8 /100 | #181 | Fair $101,617 |
| Tsimshian | 35.9 /100 | #182 | Fair $101,543 |
| Kenyans | 34.5 /100 | #183 | Fair $101,417 |
| Immigrants | Costa Rica | 33.7 /100 | #184 | Fair $101,354 |
| Dutch | 31.9 /100 | #185 | Fair $101,192 |
| Celtics | 31.3 /100 | #186 | Fair $101,139 |
| Tlingit-Haida | 30.8 /100 | #187 | Fair $101,092 |
| Guamanians/Chamorros | 30.5 /100 | #188 | Fair $101,061 |
| Immigrants | Portugal | 29.6 /100 | #189 | Fair $100,984 |
| Immigrants | Immigrants | 29.4 /100 | #190 | Fair $100,962 |
| Colombians | 27.2 /100 | #191 | Fair $100,750 |
| Immigrants | Kenya | 26.5 /100 | #192 | Fair $100,679 |
| Iraqis | 26.3 /100 | #193 | Fair $100,658 |
| Uruguayans | 26.3 /100 | #194 | Fair $100,656 |
Demographics Similar to Arapaho by Median Family Income
In terms of median family income, the demographic groups most similar to Arapaho are Black/African American ($81,912, a difference of 0.18%), Immigrants from Congo ($82,216, a difference of 0.19%), Dutch West Indian ($81,852, a difference of 0.26%), Sioux ($82,386, a difference of 0.39%), and Creek ($82,560, a difference of 0.61%).
| Demographics | Rating | Rank | Median Family Income |
| Seminole | 0.0 /100 | #320 | Tragic $83,354 |
| Immigrants | Caribbean | 0.0 /100 | #321 | Tragic $83,319 |
| Dominicans | 0.0 /100 | #322 | Tragic $82,888 |
| Bahamians | 0.0 /100 | #323 | Tragic $82,631 |
| Creek | 0.0 /100 | #324 | Tragic $82,560 |
| Sioux | 0.0 /100 | #325 | Tragic $82,386 |
| Immigrants | Congo | 0.0 /100 | #326 | Tragic $82,216 |
| Arapaho | 0.0 /100 | #327 | Tragic $82,064 |
| Blacks/African Americans | 0.0 /100 | #328 | Tragic $81,912 |
| Dutch West Indians | 0.0 /100 | #329 | Tragic $81,852 |
| Cheyenne | 0.0 /100 | #330 | Tragic $81,385 |
| Immigrants | Dominican Republic | 0.0 /100 | #331 | Tragic $81,233 |
| Natives/Alaskans | 0.0 /100 | #332 | Tragic $80,908 |
| Kiowa | 0.0 /100 | #333 | Tragic $80,885 |
| Menominee | 0.0 /100 | #334 | Tragic $79,563 |