Immigrants from Chile vs Taiwanese Family Poverty
COMPARE
Immigrants from Chile
Taiwanese
Family Poverty
Family Poverty Comparison
Immigrants from Chile
Taiwanese
8.9%
FAMILY POVERTY
59.6/ 100
METRIC RATING
169th/ 347
METRIC RANK
8.2%
FAMILY POVERTY
94.6/ 100
METRIC RATING
111th/ 347
METRIC RANK
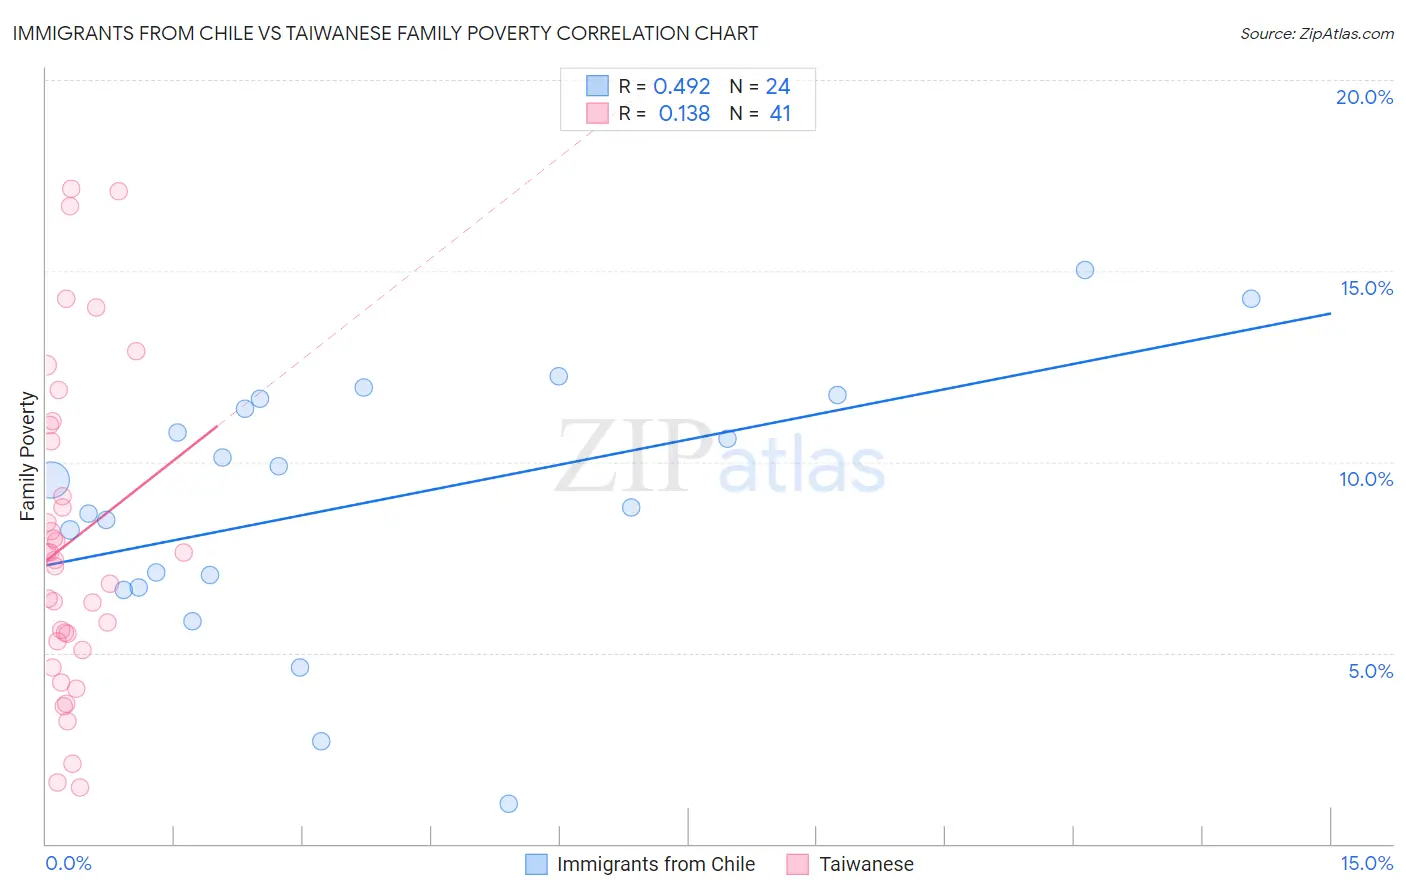
Immigrants from Chile vs Taiwanese Family Poverty Correlation Chart
The statistical analysis conducted on geographies consisting of 218,435,761 people shows a moderate positive correlation between the proportion of Immigrants from Chile and poverty level among families in the United States with a correlation coefficient (R) of 0.492 and weighted average of 8.9%. Similarly, the statistical analysis conducted on geographies consisting of 31,669,641 people shows a poor positive correlation between the proportion of Taiwanese and poverty level among families in the United States with a correlation coefficient (R) of 0.138 and weighted average of 8.2%, a difference of 8.9%.
Family Poverty Correlation Summary
| Measurement | Immigrants from Chile | Taiwanese |
| Minimum | 1.0% | 1.5% |
| Maximum | 15.0% | 17.2% |
| Range | 14.0% | 15.7% |
| Mean | 9.0% | 7.9% |
| Median | 9.2% | 7.4% |
| Interquartile 25% (IQ1) | 6.9% | 5.2% |
| Interquartile 75% (IQ3) | 11.5% | 10.8% |
| Interquartile Range (IQR) | 4.6% | 5.6% |
| Standard Deviation (Sample) | 3.4% | 4.1% |
| Standard Deviation (Population) | 3.3% | 4.1% |
Similar Demographics by Family Poverty
Demographics Similar to Immigrants from Chile by Family Poverty
In terms of family poverty, the demographic groups most similar to Immigrants from Chile are Kenyan (8.9%, a difference of 0.19%), Lebanese (8.9%, a difference of 0.27%), Immigrants from Peru (8.9%, a difference of 0.29%), Israeli (8.9%, a difference of 0.35%), and Immigrants from Ethiopia (8.9%, a difference of 0.41%).
| Demographics | Rating | Rank | Family Poverty |
| Ethiopians | 66.3 /100 | #162 | Good 8.8% |
| Pennsylvania Germans | 66.0 /100 | #163 | Good 8.8% |
| Celtics | 64.9 /100 | #164 | Good 8.8% |
| Guamanians/Chamorros | 64.7 /100 | #165 | Good 8.8% |
| Afghans | 63.5 /100 | #166 | Good 8.8% |
| Immigrants | Ethiopia | 62.5 /100 | #167 | Good 8.9% |
| Israelis | 62.1 /100 | #168 | Good 8.9% |
| Immigrants | Chile | 59.6 /100 | #169 | Average 8.9% |
| Kenyans | 58.2 /100 | #170 | Average 8.9% |
| Lebanese | 57.6 /100 | #171 | Average 8.9% |
| Immigrants | Peru | 57.5 /100 | #172 | Average 8.9% |
| Immigrants | Fiji | 56.4 /100 | #173 | Average 8.9% |
| Immigrants | Albania | 50.0 /100 | #174 | Average 9.0% |
| Costa Ricans | 49.3 /100 | #175 | Average 9.0% |
| Immigrants | Syria | 47.5 /100 | #176 | Average 9.0% |
Demographics Similar to Taiwanese by Family Poverty
In terms of family poverty, the demographic groups most similar to Taiwanese are Romanian (8.2%, a difference of 0.060%), Immigrants from France (8.2%, a difference of 0.11%), Jordanian (8.2%, a difference of 0.15%), Basque (8.1%, a difference of 0.23%), and Canadian (8.2%, a difference of 0.28%).
| Demographics | Rating | Rank | Family Poverty |
| Slavs | 95.6 /100 | #104 | Exceptional 8.1% |
| Laotians | 95.6 /100 | #105 | Exceptional 8.1% |
| Egyptians | 95.1 /100 | #106 | Exceptional 8.1% |
| French Canadians | 95.0 /100 | #107 | Exceptional 8.1% |
| Basques | 94.9 /100 | #108 | Exceptional 8.1% |
| Jordanians | 94.8 /100 | #109 | Exceptional 8.2% |
| Romanians | 94.7 /100 | #110 | Exceptional 8.2% |
| Taiwanese | 94.6 /100 | #111 | Exceptional 8.2% |
| Immigrants | France | 94.4 /100 | #112 | Exceptional 8.2% |
| Canadians | 94.2 /100 | #113 | Exceptional 8.2% |
| Immigrants | Zimbabwe | 94.0 /100 | #114 | Exceptional 8.2% |
| Immigrants | Israel | 93.5 /100 | #115 | Exceptional 8.2% |
| South Africans | 93.4 /100 | #116 | Exceptional 8.2% |
| Immigrants | Russia | 93.2 /100 | #117 | Exceptional 8.2% |
| Immigrants | Western Europe | 92.9 /100 | #118 | Exceptional 8.2% |