Immigrants from St. Vincent and the Grenadines vs Ugandan Householder Income Over 65 years
COMPARE
Immigrants from St. Vincent and the Grenadines
Ugandan
Householder Income Over 65 years
Householder Income Over 65 years Comparison
Immigrants from St. Vincent and the Grenadines
Ugandans
$51,922
HOUSEHOLDER INCOME OVER 65 YEARS
0.0/ 100
METRIC RATING
317th/ 347
METRIC RANK
$61,177
HOUSEHOLDER INCOME OVER 65 YEARS
55.5/ 100
METRIC RATING
163rd/ 347
METRIC RANK
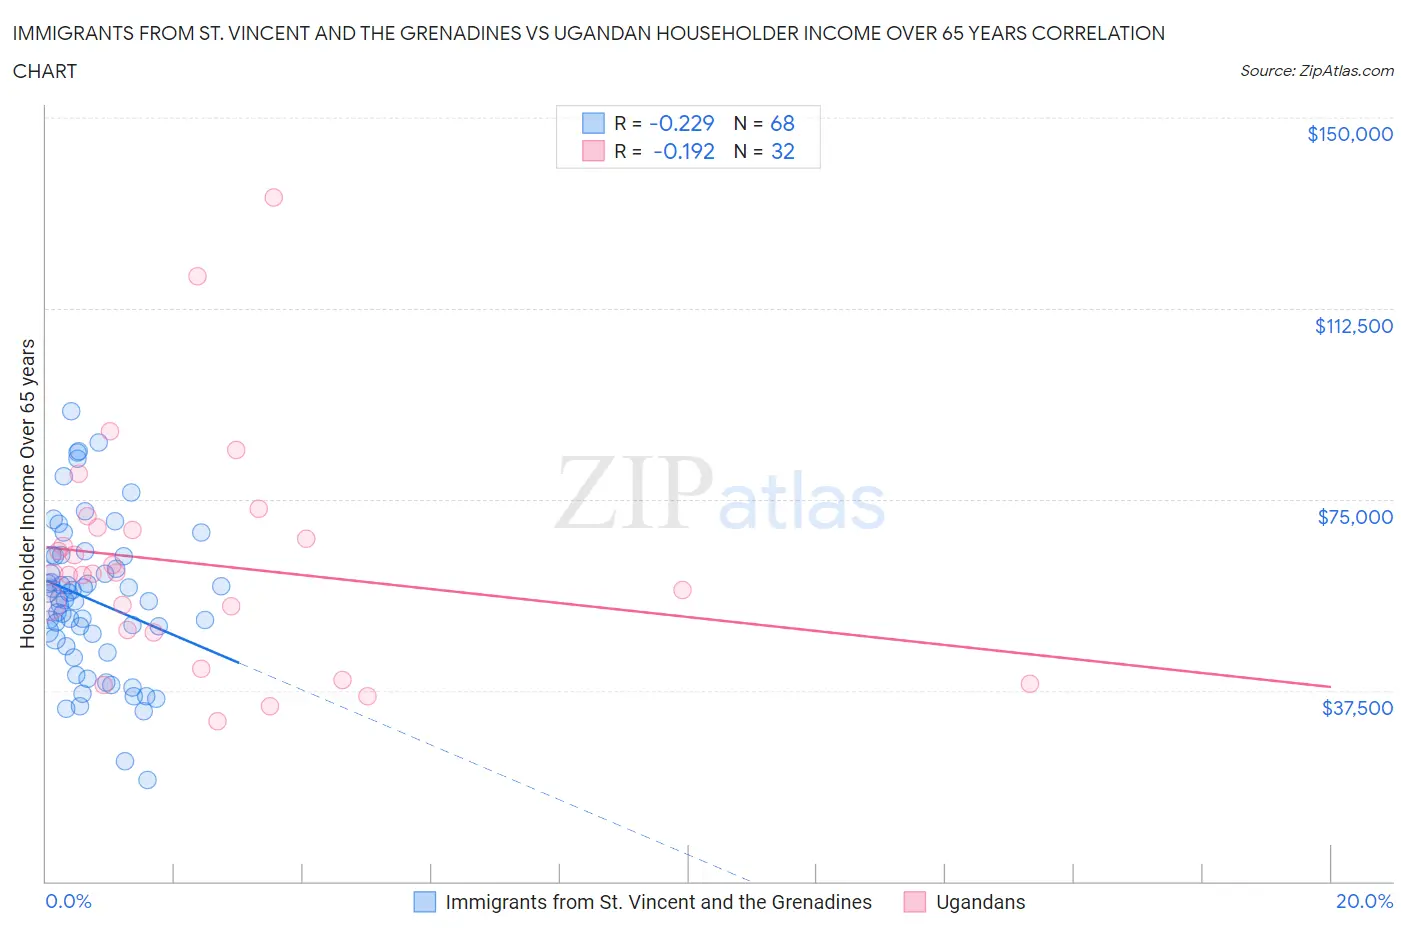
Immigrants from St. Vincent and the Grenadines vs Ugandan Householder Income Over 65 years Correlation Chart
The statistical analysis conducted on geographies consisting of 56,083,618 people shows a weak negative correlation between the proportion of Immigrants from St. Vincent and the Grenadines and household income with householder over the age of 65 in the United States with a correlation coefficient (R) of -0.229 and weighted average of $51,922. Similarly, the statistical analysis conducted on geographies consisting of 93,951,577 people shows a poor negative correlation between the proportion of Ugandans and household income with householder over the age of 65 in the United States with a correlation coefficient (R) of -0.192 and weighted average of $61,177, a difference of 17.8%.
Householder Income Over 65 years Correlation Summary
| Measurement | Immigrants from St. Vincent and the Grenadines | Ugandan |
| Minimum | $19,854 | $31,513 |
| Maximum | $92,344 | $134,340 |
| Range | $72,490 | $102,827 |
| Mean | $55,268 | $62,320 |
| Median | $55,309 | $60,326 |
| Interquartile 25% (IQ1) | $46,915 | $49,062 |
| Interquartile 75% (IQ3) | $63,847 | $69,172 |
| Interquartile Range (IQR) | $16,932 | $20,109 |
| Standard Deviation (Sample) | $14,822 | $22,191 |
| Standard Deviation (Population) | $14,713 | $21,841 |
Similar Demographics by Householder Income Over 65 years
Demographics Similar to Immigrants from St. Vincent and the Grenadines by Householder Income Over 65 years
In terms of householder income over 65 years, the demographic groups most similar to Immigrants from St. Vincent and the Grenadines are Haitian ($51,912, a difference of 0.020%), Creek ($51,949, a difference of 0.050%), Immigrants from Honduras ($51,888, a difference of 0.070%), U.S. Virgin Islander ($52,072, a difference of 0.29%), and Native/Alaskan ($52,081, a difference of 0.30%).
| Demographics | Rating | Rank | Householder Income Over 65 years |
| Sioux | 0.0 /100 | #310 | Tragic $52,509 |
| Seminole | 0.0 /100 | #311 | Tragic $52,373 |
| Immigrants | Azores | 0.0 /100 | #312 | Tragic $52,121 |
| Immigrants | Nicaragua | 0.0 /100 | #313 | Tragic $52,085 |
| Natives/Alaskans | 0.0 /100 | #314 | Tragic $52,081 |
| U.S. Virgin Islanders | 0.0 /100 | #315 | Tragic $52,072 |
| Creek | 0.0 /100 | #316 | Tragic $51,949 |
| Immigrants | St. Vincent and the Grenadines | 0.0 /100 | #317 | Tragic $51,922 |
| Haitians | 0.0 /100 | #318 | Tragic $51,912 |
| Immigrants | Honduras | 0.0 /100 | #319 | Tragic $51,888 |
| Colville | 0.0 /100 | #320 | Tragic $51,739 |
| Menominee | 0.0 /100 | #321 | Tragic $51,719 |
| British West Indians | 0.0 /100 | #322 | Tragic $51,463 |
| Cajuns | 0.0 /100 | #323 | Tragic $51,397 |
| Immigrants | Congo | 0.0 /100 | #324 | Tragic $51,393 |
Demographics Similar to Ugandans by Householder Income Over 65 years
In terms of householder income over 65 years, the demographic groups most similar to Ugandans are Immigrants from North Macedonia ($61,175, a difference of 0.0%), Immigrants from Ukraine ($61,163, a difference of 0.020%), Immigrants from Eastern Africa ($61,157, a difference of 0.030%), Czech ($61,244, a difference of 0.11%), and Norwegian ($61,104, a difference of 0.12%).
| Demographics | Rating | Rank | Householder Income Over 65 years |
| Scandinavians | 65.6 /100 | #156 | Good $61,586 |
| Macedonians | 65.1 /100 | #157 | Good $61,564 |
| English | 63.3 /100 | #158 | Good $61,487 |
| Brazilians | 62.7 /100 | #159 | Good $61,465 |
| Portuguese | 62.1 /100 | #160 | Good $61,440 |
| Icelanders | 57.9 /100 | #161 | Average $61,270 |
| Czechs | 57.2 /100 | #162 | Average $61,244 |
| Ugandans | 55.5 /100 | #163 | Average $61,177 |
| Immigrants | North Macedonia | 55.4 /100 | #164 | Average $61,175 |
| Immigrants | Ukraine | 55.1 /100 | #165 | Average $61,163 |
| Immigrants | Eastern Africa | 55.0 /100 | #166 | Average $61,157 |
| Norwegians | 53.6 /100 | #167 | Average $61,104 |
| Irish | 53.4 /100 | #168 | Average $61,097 |
| Carpatho Rusyns | 53.3 /100 | #169 | Average $61,093 |
| Serbians | 53.1 /100 | #170 | Average $61,087 |