Black/African American vs Ugandan Disability Age 5 to 17
COMPARE
Black/African American
Ugandan
Disability Age 5 to 17
Disability Age 5 to 17 Comparison
Blacks/African Americans
Ugandans
6.8%
DISABILITY AGE 5 TO 17
0.0/ 100
METRIC RATING
333rd/ 347
METRIC RANK
6.2%
DISABILITY AGE 5 TO 17
0.0/ 100
METRIC RATING
283rd/ 347
METRIC RANK
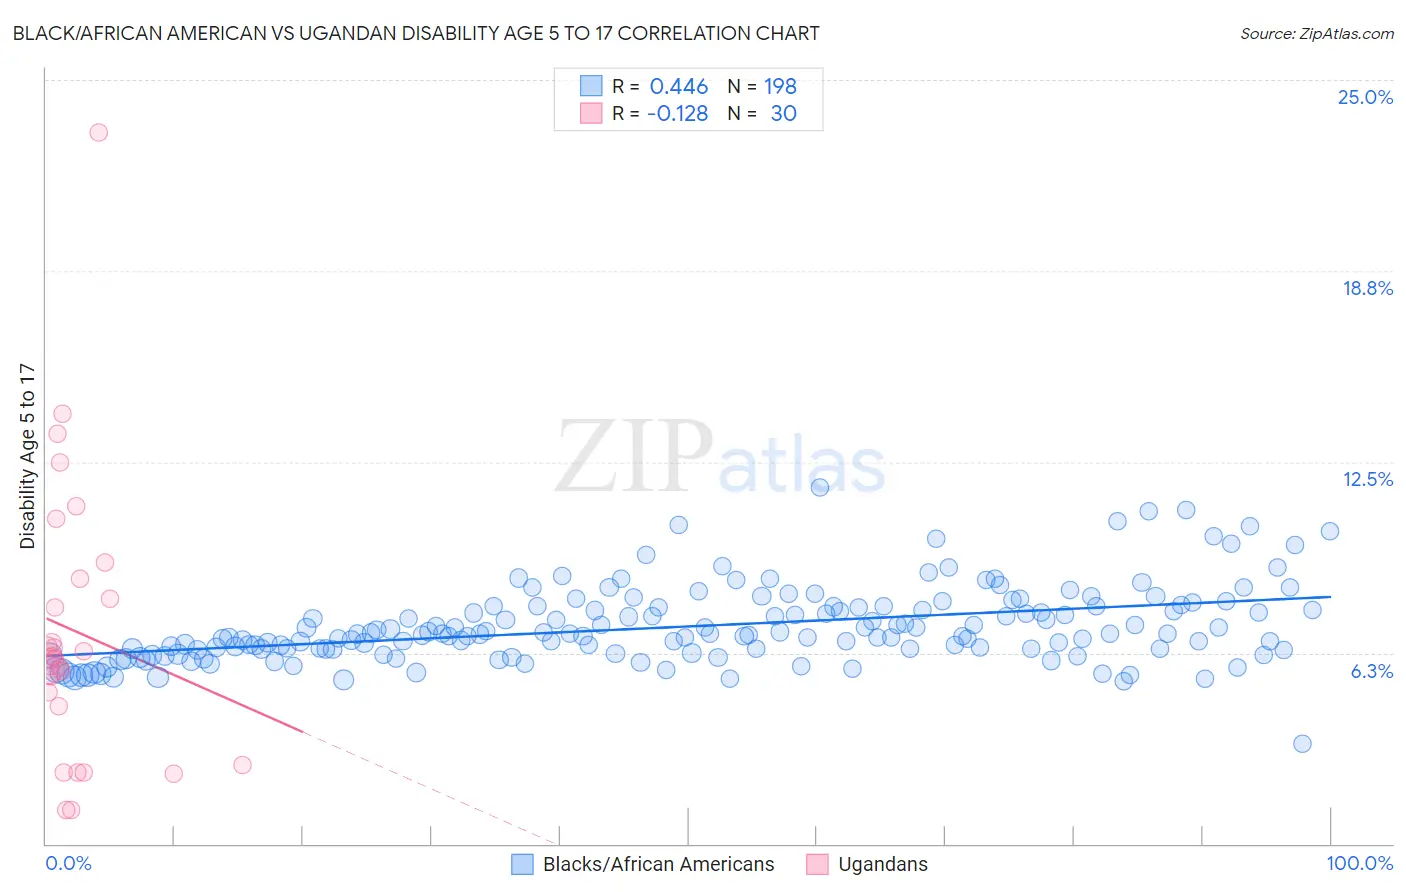
Black/African American vs Ugandan Disability Age 5 to 17 Correlation Chart
The statistical analysis conducted on geographies consisting of 554,198,505 people shows a moderate positive correlation between the proportion of Blacks/African Americans and percentage of population with a disability between the ages 5 and 17 in the United States with a correlation coefficient (R) of 0.446 and weighted average of 6.8%. Similarly, the statistical analysis conducted on geographies consisting of 93,800,816 people shows a poor negative correlation between the proportion of Ugandans and percentage of population with a disability between the ages 5 and 17 in the United States with a correlation coefficient (R) of -0.128 and weighted average of 6.2%, a difference of 9.7%.
Disability Age 5 to 17 Correlation Summary
| Measurement | Black/African American | Ugandan |
| Minimum | 3.3% | 1.1% |
| Maximum | 11.7% | 23.3% |
| Range | 8.4% | 22.2% |
| Mean | 7.1% | 7.0% |
| Median | 6.8% | 6.1% |
| Interquartile 25% (IQ1) | 6.3% | 4.5% |
| Interquartile 75% (IQ3) | 7.7% | 8.7% |
| Interquartile Range (IQR) | 1.4% | 4.2% |
| Standard Deviation (Sample) | 1.2% | 4.6% |
| Standard Deviation (Population) | 1.2% | 4.6% |
Similar Demographics by Disability Age 5 to 17
Demographics Similar to Blacks/African Americans by Disability Age 5 to 17
In terms of disability age 5 to 17, the demographic groups most similar to Blacks/African Americans are Seminole (6.8%, a difference of 0.050%), Immigrants from the Azores (6.7%, a difference of 0.59%), French Canadian (6.7%, a difference of 0.61%), Dutch West Indian (6.7%, a difference of 0.69%), and Ottawa (6.8%, a difference of 0.75%).
| Demographics | Rating | Rank | Disability Age 5 to 17 |
| Potawatomi | 0.0 /100 | #326 | Tragic 6.5% |
| French American Indians | 0.0 /100 | #327 | Tragic 6.6% |
| Pennsylvania Germans | 0.0 /100 | #328 | Tragic 6.6% |
| Blackfeet | 0.0 /100 | #329 | Tragic 6.6% |
| Dutch West Indians | 0.0 /100 | #330 | Tragic 6.7% |
| French Canadians | 0.0 /100 | #331 | Tragic 6.7% |
| Immigrants | Azores | 0.0 /100 | #332 | Tragic 6.7% |
| Blacks/African Americans | 0.0 /100 | #333 | Tragic 6.8% |
| Seminole | 0.0 /100 | #334 | Tragic 6.8% |
| Ottawa | 0.0 /100 | #335 | Tragic 6.8% |
| Chickasaw | 0.0 /100 | #336 | Tragic 6.8% |
| Creek | 0.0 /100 | #337 | Tragic 6.9% |
| Iroquois | 0.0 /100 | #338 | Tragic 6.9% |
| Choctaw | 0.0 /100 | #339 | Tragic 6.9% |
| Cherokee | 0.0 /100 | #340 | Tragic 6.9% |
Demographics Similar to Ugandans by Disability Age 5 to 17
In terms of disability age 5 to 17, the demographic groups most similar to Ugandans are Subsaharan African (6.2%, a difference of 0.030%), English (6.2%, a difference of 0.030%), Colville (6.2%, a difference of 0.070%), German (6.1%, a difference of 0.16%), and Pima (6.2%, a difference of 0.26%).
| Demographics | Rating | Rank | Disability Age 5 to 17 |
| Japanese | 0.1 /100 | #276 | Tragic 6.1% |
| Puget Sound Salish | 0.1 /100 | #277 | Tragic 6.1% |
| Immigrants | Liberia | 0.1 /100 | #278 | Tragic 6.1% |
| Immigrants | Jamaica | 0.1 /100 | #279 | Tragic 6.1% |
| Portuguese | 0.1 /100 | #280 | Tragic 6.1% |
| Scottish | 0.0 /100 | #281 | Tragic 6.1% |
| Germans | 0.0 /100 | #282 | Tragic 6.1% |
| Ugandans | 0.0 /100 | #283 | Tragic 6.2% |
| Sub-Saharan Africans | 0.0 /100 | #284 | Tragic 6.2% |
| English | 0.0 /100 | #285 | Tragic 6.2% |
| Colville | 0.0 /100 | #286 | Tragic 6.2% |
| Pima | 0.0 /100 | #287 | Tragic 6.2% |
| Jamaicans | 0.0 /100 | #288 | Tragic 6.2% |
| Yaqui | 0.0 /100 | #289 | Tragic 6.2% |
| Immigrants | Congo | 0.0 /100 | #290 | Tragic 6.2% |