Soviet Union vs Pueblo Householder Income Over 65 years
COMPARE
Soviet Union
Pueblo
Householder Income Over 65 years
Householder Income Over 65 years Comparison
Soviet Union
Pueblo
$62,848
HOUSEHOLDER INCOME OVER 65 YEARS
87.8/ 100
METRIC RATING
125th/ 347
METRIC RANK
$52,930
HOUSEHOLDER INCOME OVER 65 YEARS
0.0/ 100
METRIC RATING
305th/ 347
METRIC RANK
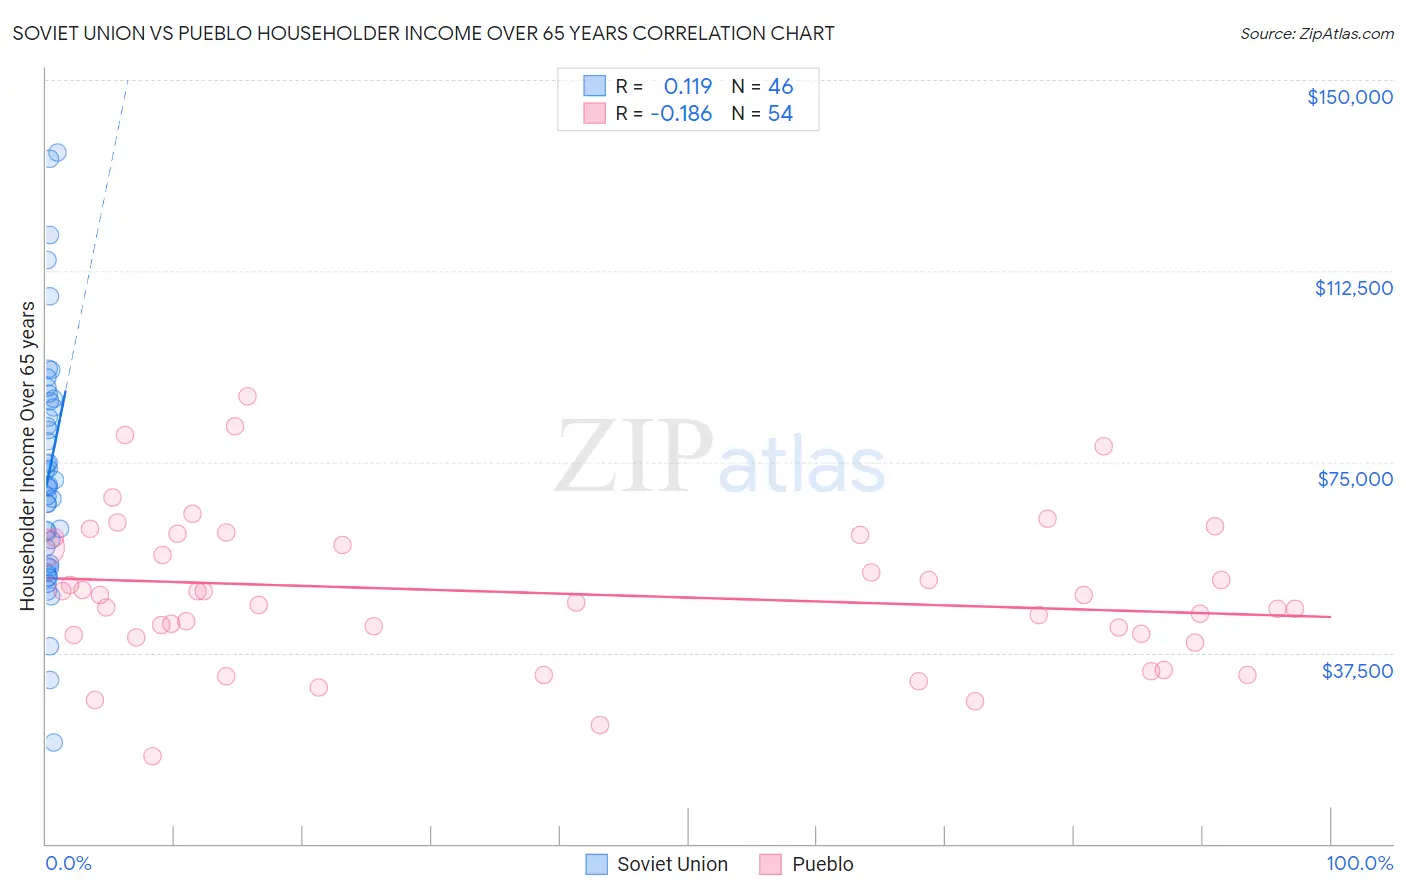
Soviet Union vs Pueblo Householder Income Over 65 years Correlation Chart
The statistical analysis conducted on geographies consisting of 43,499,158 people shows a poor positive correlation between the proportion of Soviet Union and household income with householder over the age of 65 in the United States with a correlation coefficient (R) of 0.119 and weighted average of $62,848. Similarly, the statistical analysis conducted on geographies consisting of 119,861,593 people shows a poor negative correlation between the proportion of Pueblo and household income with householder over the age of 65 in the United States with a correlation coefficient (R) of -0.186 and weighted average of $52,930, a difference of 18.7%.
Householder Income Over 65 years Correlation Summary
| Measurement | Soviet Union | Pueblo |
| Minimum | $19,854 | $17,188 |
| Maximum | $135,833 | $87,917 |
| Range | $115,979 | $70,729 |
| Mean | $73,206 | $49,255 |
| Median | $70,343 | $48,042 |
| Interquartile 25% (IQ1) | $54,958 | $41,107 |
| Interquartile 75% (IQ3) | $87,025 | $60,136 |
| Interquartile Range (IQR) | $32,067 | $19,029 |
| Standard Deviation (Sample) | $23,972 | $14,756 |
| Standard Deviation (Population) | $23,710 | $14,619 |
Similar Demographics by Householder Income Over 65 years
Demographics Similar to Soviet Union by Householder Income Over 65 years
In terms of householder income over 65 years, the demographic groups most similar to Soviet Union are Taiwanese ($62,894, a difference of 0.070%), Tlingit-Haida ($62,922, a difference of 0.12%), Peruvian ($62,766, a difference of 0.13%), Immigrants from Moldova ($62,939, a difference of 0.14%), and Swedish ($62,736, a difference of 0.18%).
| Demographics | Rating | Rank | Householder Income Over 65 years |
| Danes | 90.5 /100 | #118 | Exceptional $63,117 |
| Immigrants | Jordan | 89.8 /100 | #119 | Excellent $63,041 |
| Ukrainians | 89.7 /100 | #120 | Excellent $63,032 |
| Immigrants | Vietnam | 89.5 /100 | #121 | Excellent $63,014 |
| Immigrants | Moldova | 88.7 /100 | #122 | Excellent $62,939 |
| Tlingit-Haida | 88.6 /100 | #123 | Excellent $62,922 |
| Taiwanese | 88.3 /100 | #124 | Excellent $62,894 |
| Soviet Union | 87.8 /100 | #125 | Excellent $62,848 |
| Peruvians | 86.8 /100 | #126 | Excellent $62,766 |
| Swedes | 86.4 /100 | #127 | Excellent $62,736 |
| Aleuts | 86.1 /100 | #128 | Excellent $62,708 |
| Immigrants | Eastern Europe | 85.9 /100 | #129 | Excellent $62,693 |
| Basques | 85.4 /100 | #130 | Excellent $62,653 |
| Immigrants | Western Asia | 85.3 /100 | #131 | Excellent $62,645 |
| Immigrants | Germany | 83.9 /100 | #132 | Excellent $62,544 |
Demographics Similar to Pueblo by Householder Income Over 65 years
In terms of householder income over 65 years, the demographic groups most similar to Pueblo are Ute ($52,949, a difference of 0.040%), Pennsylvania German ($52,888, a difference of 0.080%), Hispanic or Latino ($52,832, a difference of 0.19%), Immigrants from Mexico ($52,801, a difference of 0.24%), and Choctaw ($53,060, a difference of 0.25%).
| Demographics | Rating | Rank | Householder Income Over 65 years |
| Central American Indians | 0.0 /100 | #298 | Tragic $53,232 |
| Ottawa | 0.0 /100 | #299 | Tragic $53,217 |
| Immigrants | Bahamas | 0.0 /100 | #300 | Tragic $53,174 |
| Yuman | 0.0 /100 | #301 | Tragic $53,110 |
| Spanish American Indians | 0.0 /100 | #302 | Tragic $53,077 |
| Choctaw | 0.0 /100 | #303 | Tragic $53,060 |
| Ute | 0.0 /100 | #304 | Tragic $52,949 |
| Pueblo | 0.0 /100 | #305 | Tragic $52,930 |
| Pennsylvania Germans | 0.0 /100 | #306 | Tragic $52,888 |
| Hispanics or Latinos | 0.0 /100 | #307 | Tragic $52,832 |
| Immigrants | Mexico | 0.0 /100 | #308 | Tragic $52,801 |
| Hondurans | 0.0 /100 | #309 | Tragic $52,634 |
| Sioux | 0.0 /100 | #310 | Tragic $52,509 |
| Seminole | 0.0 /100 | #311 | Tragic $52,373 |
| Immigrants | Azores | 0.0 /100 | #312 | Tragic $52,121 |