Navajo vs Pueblo Householder Income Over 65 years
COMPARE
Navajo
Pueblo
Householder Income Over 65 years
Householder Income Over 65 years Comparison
Navajo
Pueblo
$47,722
HOUSEHOLDER INCOME OVER 65 YEARS
0.0/ 100
METRIC RATING
339th/ 347
METRIC RANK
$52,930
HOUSEHOLDER INCOME OVER 65 YEARS
0.0/ 100
METRIC RATING
305th/ 347
METRIC RANK
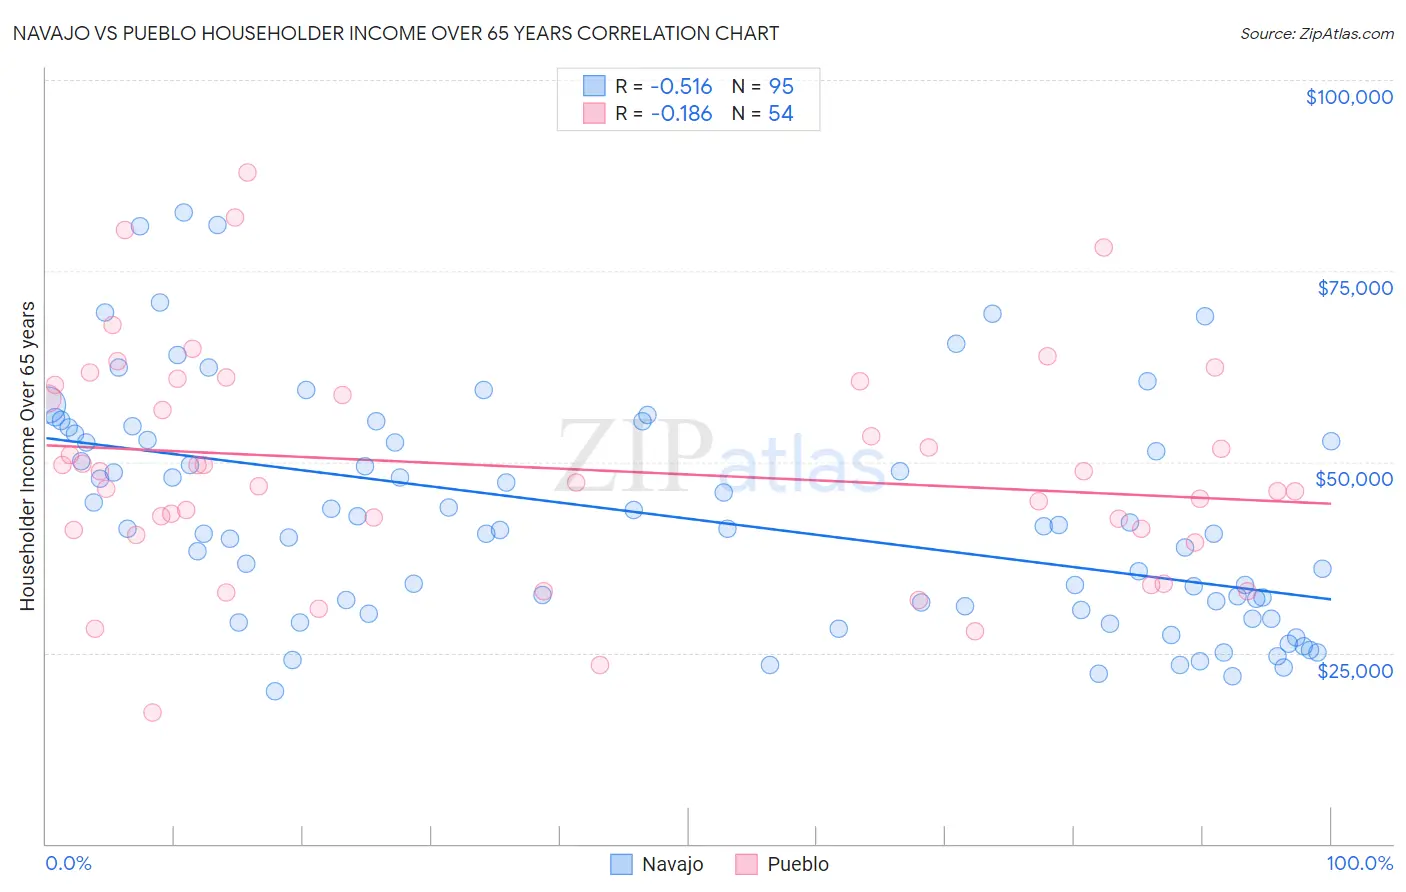
Navajo vs Pueblo Householder Income Over 65 years Correlation Chart
The statistical analysis conducted on geographies consisting of 223,856,199 people shows a substantial negative correlation between the proportion of Navajo and household income with householder over the age of 65 in the United States with a correlation coefficient (R) of -0.516 and weighted average of $47,722. Similarly, the statistical analysis conducted on geographies consisting of 119,861,593 people shows a poor negative correlation between the proportion of Pueblo and household income with householder over the age of 65 in the United States with a correlation coefficient (R) of -0.186 and weighted average of $52,930, a difference of 10.9%.
Householder Income Over 65 years Correlation Summary
| Measurement | Navajo | Pueblo |
| Minimum | $20,040 | $17,188 |
| Maximum | $82,574 | $87,917 |
| Range | $62,535 | $70,729 |
| Mean | $42,837 | $49,255 |
| Median | $41,250 | $48,042 |
| Interquartile 25% (IQ1) | $30,625 | $41,107 |
| Interquartile 75% (IQ3) | $52,850 | $60,136 |
| Interquartile Range (IQR) | $22,225 | $19,029 |
| Standard Deviation (Sample) | $14,837 | $14,756 |
| Standard Deviation (Population) | $14,759 | $14,619 |
Similar Demographics by Householder Income Over 65 years
Demographics Similar to Navajo by Householder Income Over 65 years
In terms of householder income over 65 years, the demographic groups most similar to Navajo are Immigrants from Yemen ($47,527, a difference of 0.41%), Dominican ($46,964, a difference of 1.6%), Immigrants from Caribbean ($48,535, a difference of 1.7%), Immigrants from Cabo Verde ($46,654, a difference of 2.3%), and Tohono O'odham ($49,121, a difference of 2.9%).
| Demographics | Rating | Rank | Householder Income Over 65 years |
| Dutch West Indians | 0.0 /100 | #332 | Tragic $50,475 |
| Cape Verdeans | 0.0 /100 | #333 | Tragic $50,077 |
| Immigrants | Dominica | 0.0 /100 | #334 | Tragic $50,071 |
| Crow | 0.0 /100 | #335 | Tragic $49,234 |
| Cubans | 0.0 /100 | #336 | Tragic $49,152 |
| Tohono O'odham | 0.0 /100 | #337 | Tragic $49,121 |
| Immigrants | Caribbean | 0.0 /100 | #338 | Tragic $48,535 |
| Navajo | 0.0 /100 | #339 | Tragic $47,722 |
| Immigrants | Yemen | 0.0 /100 | #340 | Tragic $47,527 |
| Dominicans | 0.0 /100 | #341 | Tragic $46,964 |
| Immigrants | Cabo Verde | 0.0 /100 | #342 | Tragic $46,654 |
| Immigrants | Dominican Republic | 0.0 /100 | #343 | Tragic $45,758 |
| Houma | 0.0 /100 | #344 | Tragic $44,822 |
| Immigrants | Cuba | 0.0 /100 | #345 | Tragic $44,735 |
| Puerto Ricans | 0.0 /100 | #346 | Tragic $42,550 |
Demographics Similar to Pueblo by Householder Income Over 65 years
In terms of householder income over 65 years, the demographic groups most similar to Pueblo are Ute ($52,949, a difference of 0.040%), Pennsylvania German ($52,888, a difference of 0.080%), Hispanic or Latino ($52,832, a difference of 0.19%), Immigrants from Mexico ($52,801, a difference of 0.24%), and Choctaw ($53,060, a difference of 0.25%).
| Demographics | Rating | Rank | Householder Income Over 65 years |
| Central American Indians | 0.0 /100 | #298 | Tragic $53,232 |
| Ottawa | 0.0 /100 | #299 | Tragic $53,217 |
| Immigrants | Bahamas | 0.0 /100 | #300 | Tragic $53,174 |
| Yuman | 0.0 /100 | #301 | Tragic $53,110 |
| Spanish American Indians | 0.0 /100 | #302 | Tragic $53,077 |
| Choctaw | 0.0 /100 | #303 | Tragic $53,060 |
| Ute | 0.0 /100 | #304 | Tragic $52,949 |
| Pueblo | 0.0 /100 | #305 | Tragic $52,930 |
| Pennsylvania Germans | 0.0 /100 | #306 | Tragic $52,888 |
| Hispanics or Latinos | 0.0 /100 | #307 | Tragic $52,832 |
| Immigrants | Mexico | 0.0 /100 | #308 | Tragic $52,801 |
| Hondurans | 0.0 /100 | #309 | Tragic $52,634 |
| Sioux | 0.0 /100 | #310 | Tragic $52,509 |
| Seminole | 0.0 /100 | #311 | Tragic $52,373 |
| Immigrants | Azores | 0.0 /100 | #312 | Tragic $52,121 |