African vs Pueblo Householder Income Over 65 years
COMPARE
African
Pueblo
Householder Income Over 65 years
Householder Income Over 65 years Comparison
Africans
Pueblo
$53,711
HOUSEHOLDER INCOME OVER 65 YEARS
0.0/ 100
METRIC RATING
291st/ 347
METRIC RANK
$52,930
HOUSEHOLDER INCOME OVER 65 YEARS
0.0/ 100
METRIC RATING
305th/ 347
METRIC RANK
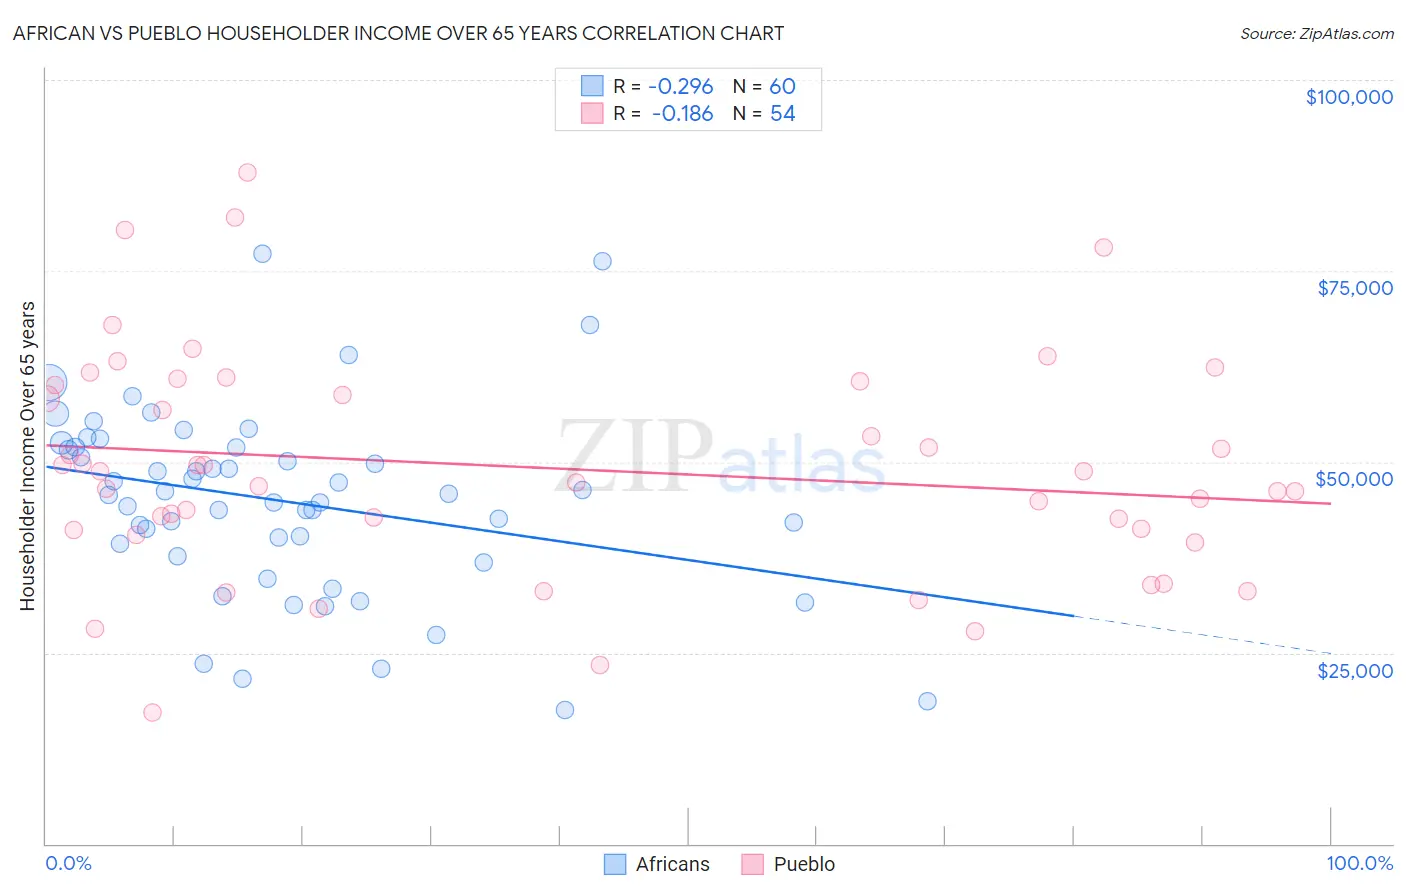
African vs Pueblo Householder Income Over 65 years Correlation Chart
The statistical analysis conducted on geographies consisting of 467,455,412 people shows a weak negative correlation between the proportion of Africans and household income with householder over the age of 65 in the United States with a correlation coefficient (R) of -0.296 and weighted average of $53,711. Similarly, the statistical analysis conducted on geographies consisting of 119,861,593 people shows a poor negative correlation between the proportion of Pueblo and household income with householder over the age of 65 in the United States with a correlation coefficient (R) of -0.186 and weighted average of $52,930, a difference of 1.5%.
Householder Income Over 65 years Correlation Summary
| Measurement | African | Pueblo |
| Minimum | $17,550 | $17,188 |
| Maximum | $77,178 | $87,917 |
| Range | $59,628 | $70,729 |
| Mean | $44,897 | $49,255 |
| Median | $45,715 | $48,042 |
| Interquartile 25% (IQ1) | $38,427 | $41,107 |
| Interquartile 75% (IQ3) | $51,942 | $60,136 |
| Interquartile Range (IQR) | $13,515 | $19,029 |
| Standard Deviation (Sample) | $12,357 | $14,756 |
| Standard Deviation (Population) | $12,253 | $14,619 |
Demographics Similar to Africans and Pueblo by Householder Income Over 65 years
In terms of householder income over 65 years, the demographic groups most similar to Africans are Chickasaw ($53,732, a difference of 0.040%), Iroquois ($53,737, a difference of 0.050%), Shoshone ($53,681, a difference of 0.060%), Paiute ($53,762, a difference of 0.090%), and Immigrants from Belize ($53,665, a difference of 0.090%). Similarly, the demographic groups most similar to Pueblo are Ute ($52,949, a difference of 0.040%), Pennsylvania German ($52,888, a difference of 0.080%), Hispanic or Latino ($52,832, a difference of 0.19%), Immigrants from Mexico ($52,801, a difference of 0.24%), and Choctaw ($53,060, a difference of 0.25%).
| Demographics | Rating | Rank | Householder Income Over 65 years |
| Paiute | 0.1 /100 | #288 | Tragic $53,762 |
| Iroquois | 0.1 /100 | #289 | Tragic $53,737 |
| Chickasaw | 0.1 /100 | #290 | Tragic $53,732 |
| Africans | 0.0 /100 | #291 | Tragic $53,711 |
| Shoshone | 0.0 /100 | #292 | Tragic $53,681 |
| Immigrants | Belize | 0.0 /100 | #293 | Tragic $53,665 |
| Senegalese | 0.0 /100 | #294 | Tragic $53,591 |
| Immigrants | Central America | 0.0 /100 | #295 | Tragic $53,420 |
| Immigrants | Somalia | 0.0 /100 | #296 | Tragic $53,333 |
| Immigrants | Latin America | 0.0 /100 | #297 | Tragic $53,265 |
| Central American Indians | 0.0 /100 | #298 | Tragic $53,232 |
| Ottawa | 0.0 /100 | #299 | Tragic $53,217 |
| Immigrants | Bahamas | 0.0 /100 | #300 | Tragic $53,174 |
| Yuman | 0.0 /100 | #301 | Tragic $53,110 |
| Spanish American Indians | 0.0 /100 | #302 | Tragic $53,077 |
| Choctaw | 0.0 /100 | #303 | Tragic $53,060 |
| Ute | 0.0 /100 | #304 | Tragic $52,949 |
| Pueblo | 0.0 /100 | #305 | Tragic $52,930 |
| Pennsylvania Germans | 0.0 /100 | #306 | Tragic $52,888 |
| Hispanics or Latinos | 0.0 /100 | #307 | Tragic $52,832 |
| Immigrants | Mexico | 0.0 /100 | #308 | Tragic $52,801 |