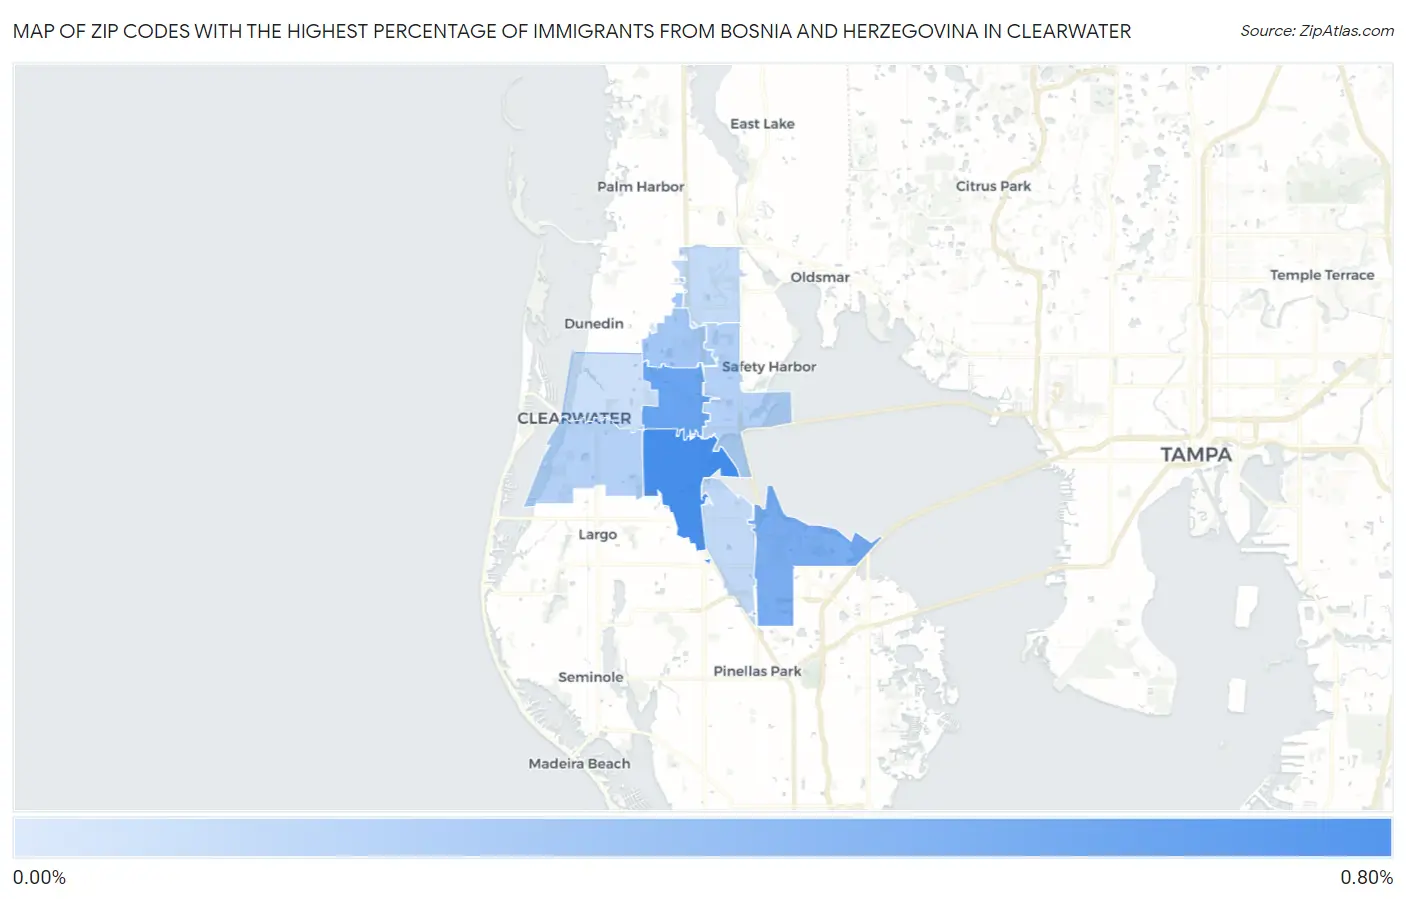
Zip Codes with the Highest Percentage of Immigrants from Bosnia and Herzegovina in Clearwater, FL
RELATED REPORTS & OPTIONS
Bosnia and Herzegovina
Clearwater
Compare Zip Codes
Map of Zip Codes with the Highest Percentage of Immigrants from Bosnia and Herzegovina in Clearwater
0.073%
0.72%
Zip Codes with the Highest Percentage of Immigrants from Bosnia and Herzegovina in Clearwater, FL
| Zip Code | Bosnia and Herzegovina | vs State | vs National | |
| 1. | 33764 | 0.72% | 0.040%(+0.679)#11 | 0.032%(+0.687)#125 |
| 2. | 33765 | 0.55% | 0.040%(+0.509)#14 | 0.032%(+0.517)#168 |
| 3. | 33762 | 0.47% | 0.040%(+0.430)#19 | 0.032%(+0.438)#204 |
| 4. | 33763 | 0.28% | 0.040%(+0.237)#33 | 0.032%(+0.245)#397 |
| 5. | 33756 | 0.20% | 0.040%(+0.159)#41 | 0.032%(+0.167)#534 |
| 6. | 33759 | 0.20% | 0.040%(+0.159)#43 | 0.032%(+0.167)#539 |
| 7. | 33760 | 0.13% | 0.040%(+0.092)#55 | 0.032%(+0.100)#747 |
| 8. | 33761 | 0.12% | 0.040%(+0.084)#60 | 0.032%(+0.092)#788 |
| 9. | 33755 | 0.073% | 0.040%(+0.033)#78 | 0.032%(+0.041)#1,069 |
1
Common Questions
What are the Top 5 Zip Codes with the Highest Percentage of Immigrants from Bosnia and Herzegovina in Clearwater, FL?
Top 5 Zip Codes with the Highest Percentage of Immigrants from Bosnia and Herzegovina in Clearwater, FL are:
What zip code has the Highest Percentage of Immigrants from Bosnia and Herzegovina in Clearwater, FL?
33764 has the Highest Percentage of Immigrants from Bosnia and Herzegovina in Clearwater, FL with 0.72%.
What is the Percentage of Immigrants from Bosnia and Herzegovina in Clearwater, FL?
Percentage of Immigrants from Bosnia and Herzegovina in Clearwater is 0.28%.
What is the Percentage of Immigrants from Bosnia and Herzegovina in Florida?
Percentage of Immigrants from Bosnia and Herzegovina in Florida is 0.040%.
What is the Percentage of Immigrants from Bosnia and Herzegovina in the United States?
Percentage of Immigrants from Bosnia and Herzegovina in the United States is 0.032%.