Zimbabwean vs Subsaharan African Currently Married
COMPARE
Zimbabwean
Subsaharan African
Currently Married
Currently Married Comparison
Zimbabweans
Sub-Saharan Africans
47.0%
CURRENTLY MARRIED
70.1/ 100
METRIC RATING
149th/ 347
METRIC RANK
42.6%
CURRENTLY MARRIED
0.0/ 100
METRIC RATING
292nd/ 347
METRIC RANK
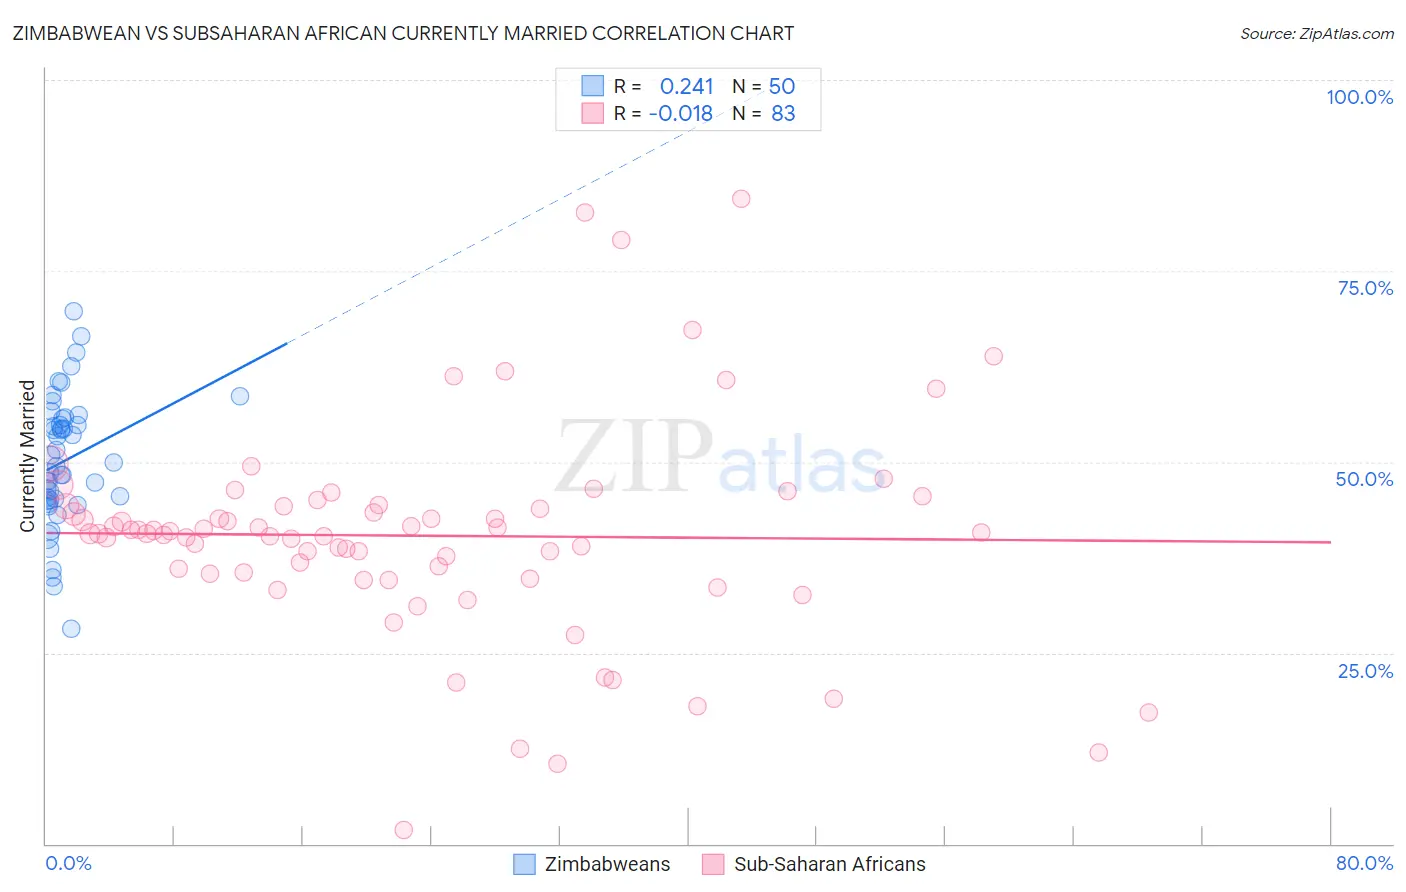
Zimbabwean vs Subsaharan African Currently Married Correlation Chart
The statistical analysis conducted on geographies consisting of 69,204,681 people shows a weak positive correlation between the proportion of Zimbabweans and percentage of population currently married in the United States with a correlation coefficient (R) of 0.241 and weighted average of 47.0%. Similarly, the statistical analysis conducted on geographies consisting of 508,112,533 people shows no correlation between the proportion of Sub-Saharan Africans and percentage of population currently married in the United States with a correlation coefficient (R) of -0.018 and weighted average of 42.6%, a difference of 10.4%.
Currently Married Correlation Summary
| Measurement | Zimbabwean | Subsaharan African |
| Minimum | 28.2% | 1.8% |
| Maximum | 69.8% | 84.5% |
| Range | 41.6% | 82.7% |
| Mean | 50.2% | 40.3% |
| Median | 49.7% | 40.7% |
| Interquartile 25% (IQ1) | 45.1% | 35.4% |
| Interquartile 75% (IQ3) | 55.6% | 44.3% |
| Interquartile Range (IQR) | 10.5% | 8.9% |
| Standard Deviation (Sample) | 8.5% | 14.0% |
| Standard Deviation (Population) | 8.5% | 13.9% |
Similar Demographics by Currently Married
Demographics Similar to Zimbabweans by Currently Married
In terms of currently married, the demographic groups most similar to Zimbabweans are Immigrants from Turkey (47.0%, a difference of 0.0%), Cambodian (47.0%, a difference of 0.010%), Chilean (47.0%, a difference of 0.010%), Immigrants from Serbia (47.0%, a difference of 0.060%), and Immigrants from Venezuela (47.0%, a difference of 0.060%).
| Demographics | Rating | Rank | Currently Married |
| Argentineans | 74.4 /100 | #142 | Good 47.1% |
| Guamanians/Chamorros | 74.2 /100 | #143 | Good 47.1% |
| Hmong | 73.4 /100 | #144 | Good 47.1% |
| Immigrants | South Eastern Asia | 72.9 /100 | #145 | Good 47.1% |
| Carpatho Rusyns | 72.6 /100 | #146 | Good 47.0% |
| Immigrants | Argentina | 72.0 /100 | #147 | Good 47.0% |
| Cambodians | 70.4 /100 | #148 | Good 47.0% |
| Zimbabweans | 70.1 /100 | #149 | Good 47.0% |
| Immigrants | Turkey | 70.0 /100 | #150 | Good 47.0% |
| Chileans | 69.8 /100 | #151 | Good 47.0% |
| Immigrants | Serbia | 68.8 /100 | #152 | Good 47.0% |
| Immigrants | Venezuela | 68.6 /100 | #153 | Good 47.0% |
| Albanians | 68.6 /100 | #154 | Good 47.0% |
| Arabs | 68.6 /100 | #155 | Good 47.0% |
| Spanish | 68.1 /100 | #156 | Good 47.0% |
Demographics Similar to Sub-Saharan Africans by Currently Married
In terms of currently married, the demographic groups most similar to Sub-Saharan Africans are Yuman (42.6%, a difference of 0.020%), Honduran (42.5%, a difference of 0.14%), Immigrants from Guatemala (42.6%, a difference of 0.16%), Immigrants from Ghana (42.7%, a difference of 0.27%), and Paiute (42.7%, a difference of 0.28%).
| Demographics | Rating | Rank | Currently Married |
| Immigrants | Middle Africa | 0.0 /100 | #285 | Tragic 43.0% |
| Ghanaians | 0.0 /100 | #286 | Tragic 42.9% |
| Guatemalans | 0.0 /100 | #287 | Tragic 42.9% |
| Natives/Alaskans | 0.0 /100 | #288 | Tragic 42.8% |
| Paiute | 0.0 /100 | #289 | Tragic 42.7% |
| Immigrants | Ghana | 0.0 /100 | #290 | Tragic 42.7% |
| Immigrants | Guatemala | 0.0 /100 | #291 | Tragic 42.6% |
| Sub-Saharan Africans | 0.0 /100 | #292 | Tragic 42.6% |
| Yuman | 0.0 /100 | #293 | Tragic 42.6% |
| Hondurans | 0.0 /100 | #294 | Tragic 42.5% |
| Immigrants | Western Africa | 0.0 /100 | #295 | Tragic 42.4% |
| Menominee | 0.0 /100 | #296 | Tragic 42.3% |
| Cheyenne | 0.0 /100 | #297 | Tragic 42.2% |
| Immigrants | Honduras | 0.0 /100 | #298 | Tragic 42.2% |
| Liberians | 0.0 /100 | #299 | Tragic 42.2% |