Zimbabwean vs Immigrants from Somalia Currently Married
COMPARE
Zimbabwean
Immigrants from Somalia
Currently Married
Currently Married Comparison
Zimbabweans
Immigrants from Somalia
47.0%
CURRENTLY MARRIED
70.1/ 100
METRIC RATING
149th/ 347
METRIC RANK
41.2%
CURRENTLY MARRIED
0.0/ 100
METRIC RATING
319th/ 347
METRIC RANK
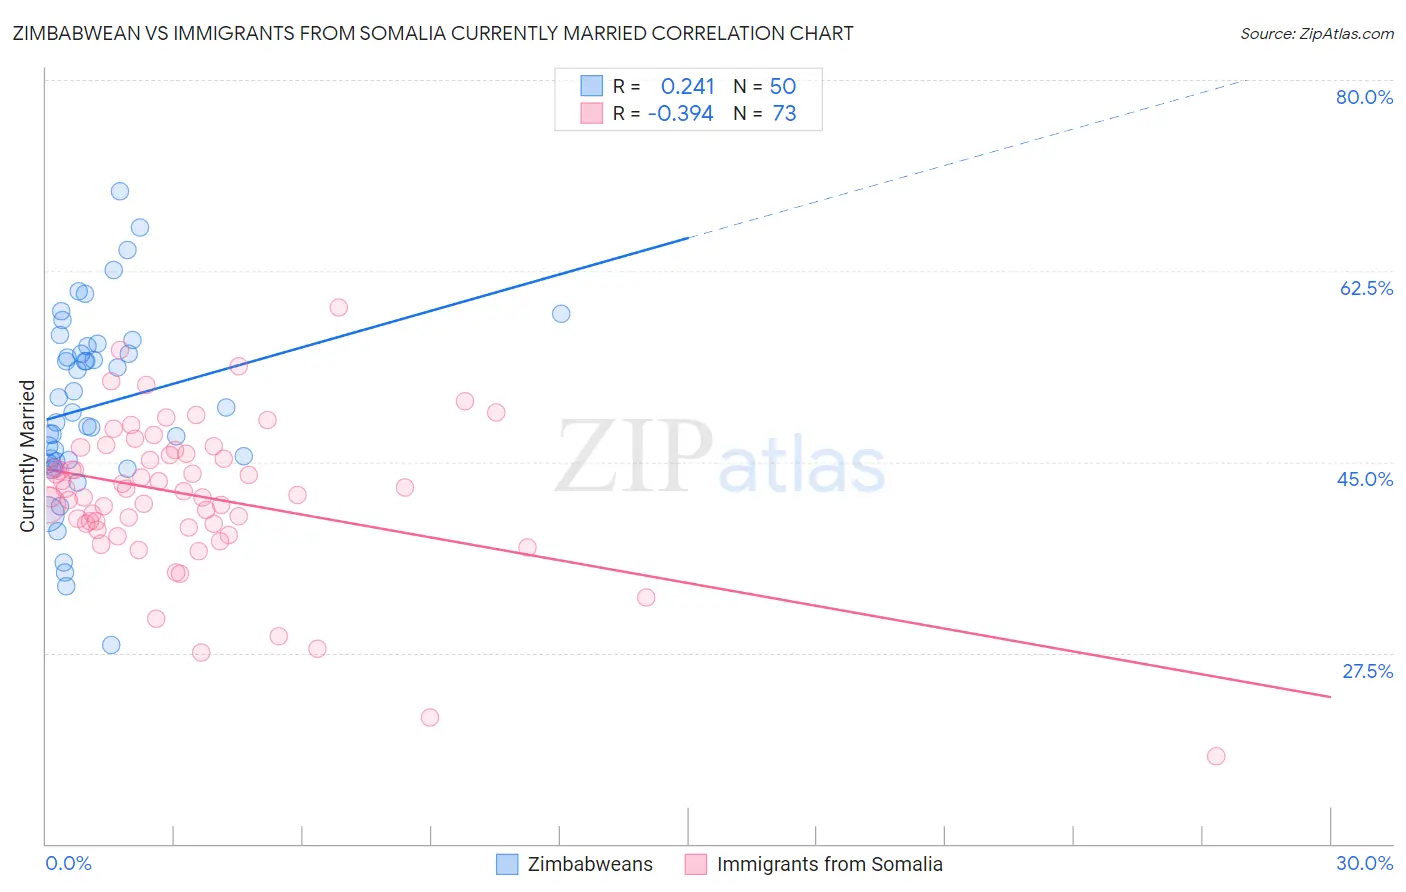
Zimbabwean vs Immigrants from Somalia Currently Married Correlation Chart
The statistical analysis conducted on geographies consisting of 69,204,681 people shows a weak positive correlation between the proportion of Zimbabweans and percentage of population currently married in the United States with a correlation coefficient (R) of 0.241 and weighted average of 47.0%. Similarly, the statistical analysis conducted on geographies consisting of 92,108,089 people shows a mild negative correlation between the proportion of Immigrants from Somalia and percentage of population currently married in the United States with a correlation coefficient (R) of -0.394 and weighted average of 41.2%, a difference of 14.1%.
Currently Married Correlation Summary
| Measurement | Zimbabwean | Immigrants from Somalia |
| Minimum | 28.2% | 18.0% |
| Maximum | 69.8% | 59.1% |
| Range | 41.6% | 41.1% |
| Mean | 50.2% | 41.9% |
| Median | 49.7% | 42.3% |
| Interquartile 25% (IQ1) | 45.1% | 39.1% |
| Interquartile 75% (IQ3) | 55.6% | 45.9% |
| Interquartile Range (IQR) | 10.5% | 6.8% |
| Standard Deviation (Sample) | 8.5% | 7.0% |
| Standard Deviation (Population) | 8.5% | 6.9% |
Similar Demographics by Currently Married
Demographics Similar to Zimbabweans by Currently Married
In terms of currently married, the demographic groups most similar to Zimbabweans are Immigrants from Turkey (47.0%, a difference of 0.0%), Cambodian (47.0%, a difference of 0.010%), Chilean (47.0%, a difference of 0.010%), Immigrants from Serbia (47.0%, a difference of 0.060%), and Immigrants from Venezuela (47.0%, a difference of 0.060%).
| Demographics | Rating | Rank | Currently Married |
| Argentineans | 74.4 /100 | #142 | Good 47.1% |
| Guamanians/Chamorros | 74.2 /100 | #143 | Good 47.1% |
| Hmong | 73.4 /100 | #144 | Good 47.1% |
| Immigrants | South Eastern Asia | 72.9 /100 | #145 | Good 47.1% |
| Carpatho Rusyns | 72.6 /100 | #146 | Good 47.0% |
| Immigrants | Argentina | 72.0 /100 | #147 | Good 47.0% |
| Cambodians | 70.4 /100 | #148 | Good 47.0% |
| Zimbabweans | 70.1 /100 | #149 | Good 47.0% |
| Immigrants | Turkey | 70.0 /100 | #150 | Good 47.0% |
| Chileans | 69.8 /100 | #151 | Good 47.0% |
| Immigrants | Serbia | 68.8 /100 | #152 | Good 47.0% |
| Immigrants | Venezuela | 68.6 /100 | #153 | Good 47.0% |
| Albanians | 68.6 /100 | #154 | Good 47.0% |
| Arabs | 68.6 /100 | #155 | Good 47.0% |
| Spanish | 68.1 /100 | #156 | Good 47.0% |
Demographics Similar to Immigrants from Somalia by Currently Married
In terms of currently married, the demographic groups most similar to Immigrants from Somalia are Bahamian (41.2%, a difference of 0.020%), Immigrants from Jamaica (41.1%, a difference of 0.060%), Haitian (41.3%, a difference of 0.20%), Immigrants from Caribbean (41.3%, a difference of 0.22%), and Inupiat (41.3%, a difference of 0.28%).
| Demographics | Rating | Rank | Currently Married |
| Somalis | 0.0 /100 | #312 | Tragic 41.5% |
| Jamaicans | 0.0 /100 | #313 | Tragic 41.4% |
| West Indians | 0.0 /100 | #314 | Tragic 41.3% |
| Inupiat | 0.0 /100 | #315 | Tragic 41.3% |
| Immigrants | Caribbean | 0.0 /100 | #316 | Tragic 41.3% |
| Haitians | 0.0 /100 | #317 | Tragic 41.3% |
| Bahamians | 0.0 /100 | #318 | Tragic 41.2% |
| Immigrants | Somalia | 0.0 /100 | #319 | Tragic 41.2% |
| Immigrants | Jamaica | 0.0 /100 | #320 | Tragic 41.1% |
| Immigrants | Congo | 0.0 /100 | #321 | Tragic 41.1% |
| Immigrants | Haiti | 0.0 /100 | #322 | Tragic 41.0% |
| Immigrants | West Indies | 0.0 /100 | #323 | Tragic 40.7% |
| Immigrants | Senegal | 0.0 /100 | #324 | Tragic 40.7% |
| U.S. Virgin Islanders | 0.0 /100 | #325 | Tragic 40.7% |
| Barbadians | 0.0 /100 | #326 | Tragic 40.6% |