Zimbabwean vs Sri Lankan Currently Married
COMPARE
Zimbabwean
Sri Lankan
Currently Married
Currently Married Comparison
Zimbabweans
Sri Lankans
47.0%
CURRENTLY MARRIED
70.1/ 100
METRIC RATING
149th/ 347
METRIC RANK
47.3%
CURRENTLY MARRIED
83.2/ 100
METRIC RATING
129th/ 347
METRIC RANK
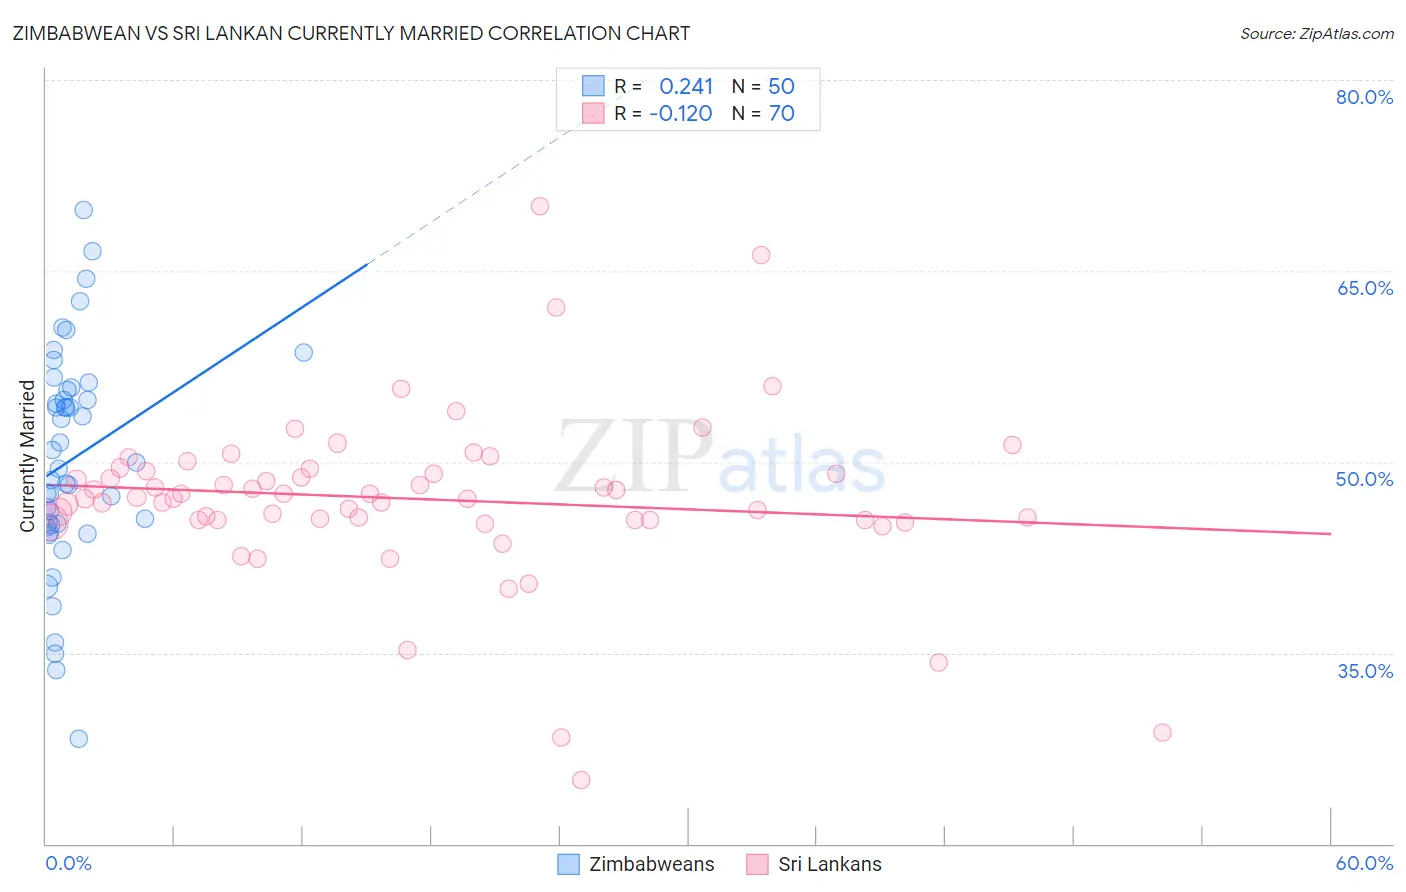
Zimbabwean vs Sri Lankan Currently Married Correlation Chart
The statistical analysis conducted on geographies consisting of 69,204,681 people shows a weak positive correlation between the proportion of Zimbabweans and percentage of population currently married in the United States with a correlation coefficient (R) of 0.241 and weighted average of 47.0%. Similarly, the statistical analysis conducted on geographies consisting of 440,506,479 people shows a poor negative correlation between the proportion of Sri Lankans and percentage of population currently married in the United States with a correlation coefficient (R) of -0.120 and weighted average of 47.3%, a difference of 0.68%.
Currently Married Correlation Summary
| Measurement | Zimbabwean | Sri Lankan |
| Minimum | 28.2% | 25.0% |
| Maximum | 69.8% | 70.1% |
| Range | 41.6% | 45.1% |
| Mean | 50.2% | 47.1% |
| Median | 49.7% | 47.2% |
| Interquartile 25% (IQ1) | 45.1% | 45.4% |
| Interquartile 75% (IQ3) | 55.6% | 49.2% |
| Interquartile Range (IQR) | 10.5% | 3.8% |
| Standard Deviation (Sample) | 8.5% | 6.8% |
| Standard Deviation (Population) | 8.5% | 6.8% |
Demographics Similar to Zimbabweans and Sri Lankans by Currently Married
In terms of currently married, the demographic groups most similar to Zimbabweans are Cambodian (47.0%, a difference of 0.010%), Immigrants from Argentina (47.0%, a difference of 0.090%), Carpatho Rusyn (47.0%, a difference of 0.11%), Immigrants from South Eastern Asia (47.1%, a difference of 0.13%), and Hmong (47.1%, a difference of 0.15%). Similarly, the demographic groups most similar to Sri Lankans are Immigrants from Iraq (47.3%, a difference of 0.030%), Icelander (47.3%, a difference of 0.050%), Afghan (47.3%, a difference of 0.090%), Immigrants from Malaysia (47.3%, a difference of 0.13%), and Immigrants from Australia (47.3%, a difference of 0.13%).
| Demographics | Rating | Rank | Currently Married |
| Sri Lankans | 83.2 /100 | #129 | Excellent 47.3% |
| Immigrants | Iraq | 82.8 /100 | #130 | Excellent 47.3% |
| Icelanders | 82.4 /100 | #131 | Excellent 47.3% |
| Afghans | 81.8 /100 | #132 | Excellent 47.3% |
| Immigrants | Malaysia | 81.1 /100 | #133 | Excellent 47.3% |
| Immigrants | Australia | 81.1 /100 | #134 | Excellent 47.3% |
| Immigrants | Norway | 79.7 /100 | #135 | Good 47.2% |
| Immigrants | Vietnam | 78.2 /100 | #136 | Good 47.2% |
| Paraguayans | 77.8 /100 | #137 | Good 47.2% |
| Pakistanis | 77.5 /100 | #138 | Good 47.2% |
| Yugoslavians | 77.4 /100 | #139 | Good 47.2% |
| Cajuns | 75.3 /100 | #140 | Good 47.1% |
| Venezuelans | 74.4 /100 | #141 | Good 47.1% |
| Argentineans | 74.4 /100 | #142 | Good 47.1% |
| Guamanians/Chamorros | 74.2 /100 | #143 | Good 47.1% |
| Hmong | 73.4 /100 | #144 | Good 47.1% |
| Immigrants | South Eastern Asia | 72.9 /100 | #145 | Good 47.1% |
| Carpatho Rusyns | 72.6 /100 | #146 | Good 47.0% |
| Immigrants | Argentina | 72.0 /100 | #147 | Good 47.0% |
| Cambodians | 70.4 /100 | #148 | Good 47.0% |
| Zimbabweans | 70.1 /100 | #149 | Good 47.0% |