Zimbabwean vs Alaska Native Currently Married
COMPARE
Zimbabwean
Alaska Native
Currently Married
Currently Married Comparison
Zimbabweans
Alaska Natives
47.0%
CURRENTLY MARRIED
70.1/ 100
METRIC RATING
149th/ 347
METRIC RANK
45.5%
CURRENTLY MARRIED
7.0/ 100
METRIC RATING
213th/ 347
METRIC RANK
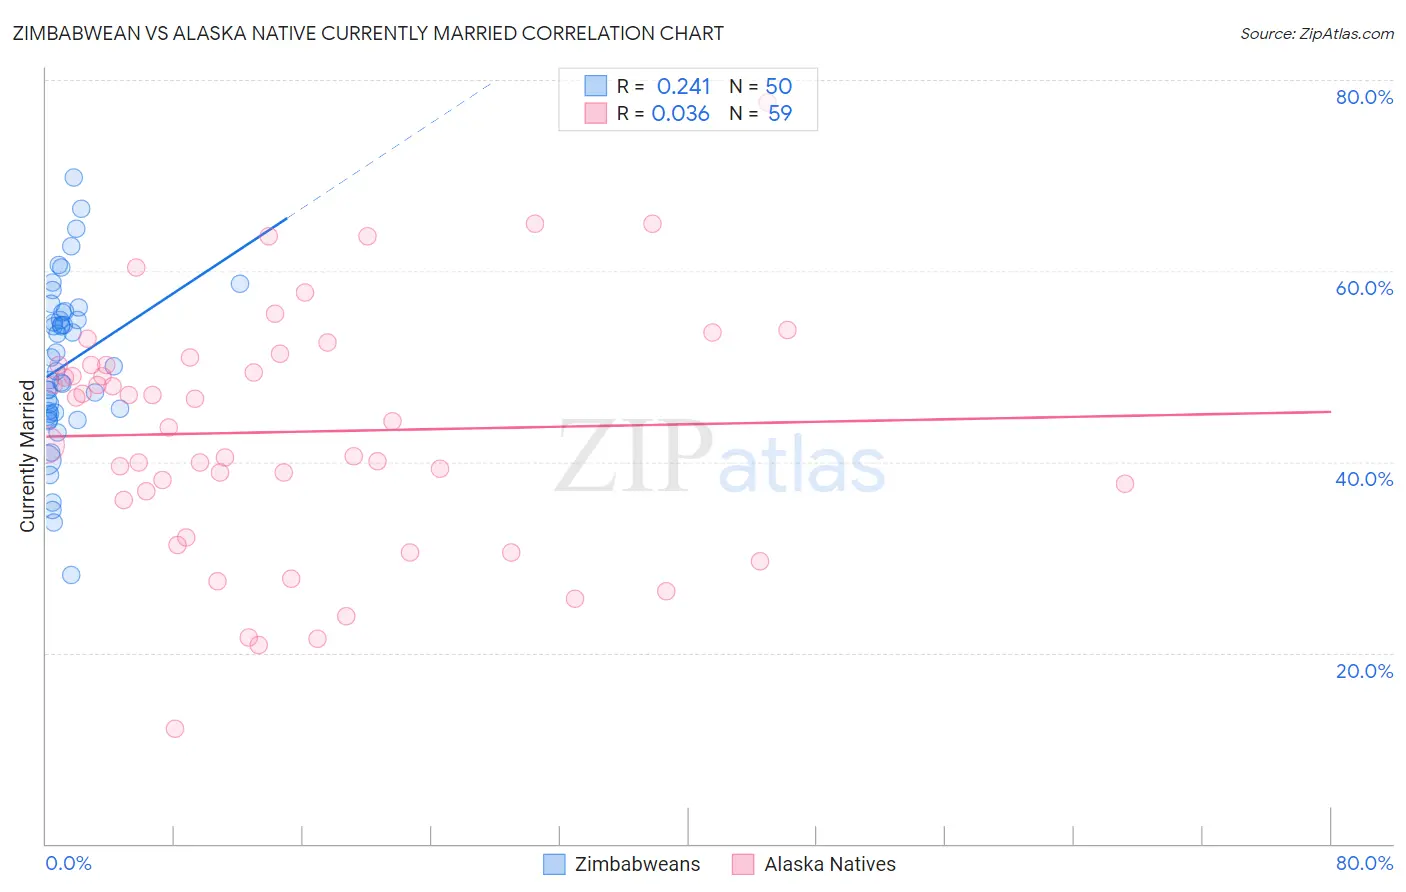
Zimbabwean vs Alaska Native Currently Married Correlation Chart
The statistical analysis conducted on geographies consisting of 69,204,681 people shows a weak positive correlation between the proportion of Zimbabweans and percentage of population currently married in the United States with a correlation coefficient (R) of 0.241 and weighted average of 47.0%. Similarly, the statistical analysis conducted on geographies consisting of 76,776,837 people shows no correlation between the proportion of Alaska Natives and percentage of population currently married in the United States with a correlation coefficient (R) of 0.036 and weighted average of 45.5%, a difference of 3.2%.
Currently Married Correlation Summary
| Measurement | Zimbabwean | Alaska Native |
| Minimum | 28.2% | 12.1% |
| Maximum | 69.8% | 77.7% |
| Range | 41.6% | 65.6% |
| Mean | 50.2% | 43.1% |
| Median | 49.7% | 44.2% |
| Interquartile 25% (IQ1) | 45.1% | 36.0% |
| Interquartile 75% (IQ3) | 55.6% | 50.2% |
| Interquartile Range (IQR) | 10.5% | 14.1% |
| Standard Deviation (Sample) | 8.5% | 12.8% |
| Standard Deviation (Population) | 8.5% | 12.7% |
Similar Demographics by Currently Married
Demographics Similar to Zimbabweans by Currently Married
In terms of currently married, the demographic groups most similar to Zimbabweans are Immigrants from Turkey (47.0%, a difference of 0.0%), Cambodian (47.0%, a difference of 0.010%), Chilean (47.0%, a difference of 0.010%), Immigrants from Serbia (47.0%, a difference of 0.060%), and Immigrants from Venezuela (47.0%, a difference of 0.060%).
| Demographics | Rating | Rank | Currently Married |
| Argentineans | 74.4 /100 | #142 | Good 47.1% |
| Guamanians/Chamorros | 74.2 /100 | #143 | Good 47.1% |
| Hmong | 73.4 /100 | #144 | Good 47.1% |
| Immigrants | South Eastern Asia | 72.9 /100 | #145 | Good 47.1% |
| Carpatho Rusyns | 72.6 /100 | #146 | Good 47.0% |
| Immigrants | Argentina | 72.0 /100 | #147 | Good 47.0% |
| Cambodians | 70.4 /100 | #148 | Good 47.0% |
| Zimbabweans | 70.1 /100 | #149 | Good 47.0% |
| Immigrants | Turkey | 70.0 /100 | #150 | Good 47.0% |
| Chileans | 69.8 /100 | #151 | Good 47.0% |
| Immigrants | Serbia | 68.8 /100 | #152 | Good 47.0% |
| Immigrants | Venezuela | 68.6 /100 | #153 | Good 47.0% |
| Albanians | 68.6 /100 | #154 | Good 47.0% |
| Arabs | 68.6 /100 | #155 | Good 47.0% |
| Spanish | 68.1 /100 | #156 | Good 47.0% |
Demographics Similar to Alaska Natives by Currently Married
In terms of currently married, the demographic groups most similar to Alaska Natives are Marshallese (45.5%, a difference of 0.030%), Houma (45.5%, a difference of 0.040%), Dutch West Indian (45.5%, a difference of 0.040%), German Russian (45.5%, a difference of 0.040%), and Uruguayan (45.6%, a difference of 0.12%).
| Demographics | Rating | Rank | Currently Married |
| Immigrants | Immigrants | 11.2 /100 | #206 | Poor 45.8% |
| Immigrants | South America | 10.8 /100 | #207 | Poor 45.7% |
| Alsatians | 10.8 /100 | #208 | Poor 45.7% |
| Immigrants | Micronesia | 8.8 /100 | #209 | Tragic 45.6% |
| Uruguayans | 7.9 /100 | #210 | Tragic 45.6% |
| Houma | 7.2 /100 | #211 | Tragic 45.5% |
| Marshallese | 7.2 /100 | #212 | Tragic 45.5% |
| Alaska Natives | 7.0 /100 | #213 | Tragic 45.5% |
| Dutch West Indians | 6.7 /100 | #214 | Tragic 45.5% |
| German Russians | 6.7 /100 | #215 | Tragic 45.5% |
| Immigrants | Morocco | 5.5 /100 | #216 | Tragic 45.4% |
| Immigrants | Thailand | 5.1 /100 | #217 | Tragic 45.4% |
| Panamanians | 4.0 /100 | #218 | Tragic 45.3% |
| Immigrants | Portugal | 3.5 /100 | #219 | Tragic 45.2% |
| Kenyans | 3.1 /100 | #220 | Tragic 45.2% |