Immigrants from Northern Europe vs Subsaharan African Currently Married
COMPARE
Immigrants from Northern Europe
Subsaharan African
Currently Married
Currently Married Comparison
Immigrants from Northern Europe
Sub-Saharan Africans
48.8%
CURRENTLY MARRIED
99.4/ 100
METRIC RATING
35th/ 347
METRIC RANK
42.6%
CURRENTLY MARRIED
0.0/ 100
METRIC RATING
292nd/ 347
METRIC RANK
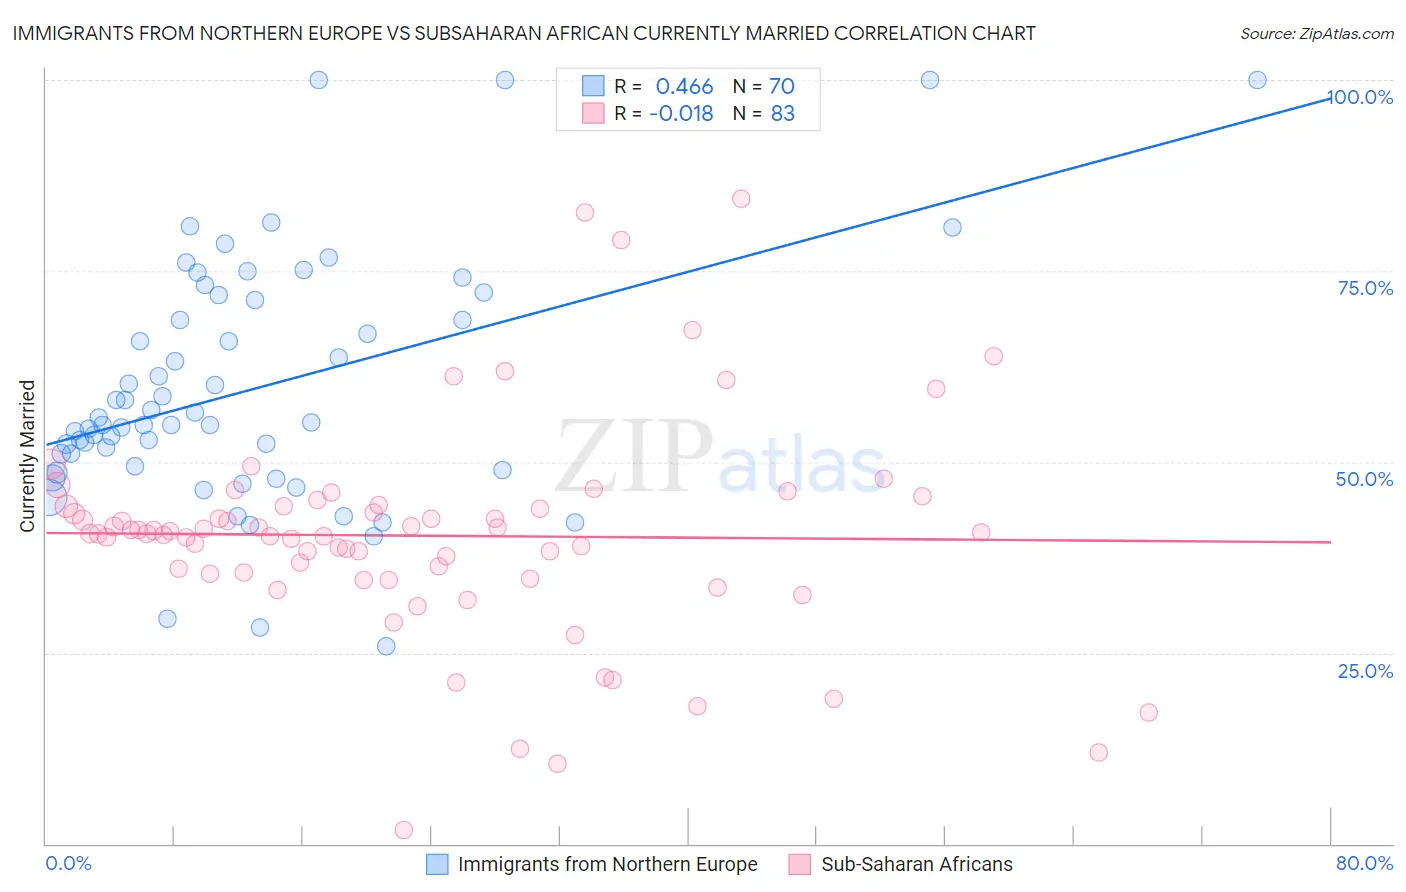
Immigrants from Northern Europe vs Subsaharan African Currently Married Correlation Chart
The statistical analysis conducted on geographies consisting of 477,179,061 people shows a moderate positive correlation between the proportion of Immigrants from Northern Europe and percentage of population currently married in the United States with a correlation coefficient (R) of 0.466 and weighted average of 48.8%. Similarly, the statistical analysis conducted on geographies consisting of 508,112,533 people shows no correlation between the proportion of Sub-Saharan Africans and percentage of population currently married in the United States with a correlation coefficient (R) of -0.018 and weighted average of 42.6%, a difference of 14.7%.
Currently Married Correlation Summary
| Measurement | Immigrants from Northern Europe | Subsaharan African |
| Minimum | 25.8% | 1.8% |
| Maximum | 100.0% | 84.5% |
| Range | 74.2% | 82.7% |
| Mean | 59.6% | 40.3% |
| Median | 55.0% | 40.7% |
| Interquartile 25% (IQ1) | 49.4% | 35.4% |
| Interquartile 75% (IQ3) | 71.2% | 44.3% |
| Interquartile Range (IQR) | 21.8% | 8.9% |
| Standard Deviation (Sample) | 16.0% | 14.0% |
| Standard Deviation (Population) | 15.9% | 13.9% |
Similar Demographics by Currently Married
Demographics Similar to Immigrants from Northern Europe by Currently Married
In terms of currently married, the demographic groups most similar to Immigrants from Northern Europe are Italian (48.8%, a difference of 0.010%), Hungarian (48.8%, a difference of 0.010%), Immigrants from Lithuania (48.8%, a difference of 0.020%), Czechoslovakian (48.8%, a difference of 0.050%), and Irish (48.9%, a difference of 0.080%).
| Demographics | Rating | Rank | Currently Married |
| Welsh | 99.5 /100 | #28 | Exceptional 48.9% |
| Croatians | 99.5 /100 | #29 | Exceptional 48.9% |
| Eastern Europeans | 99.5 /100 | #30 | Exceptional 48.9% |
| Poles | 99.5 /100 | #31 | Exceptional 48.9% |
| Immigrants | Hong Kong | 99.5 /100 | #32 | Exceptional 48.9% |
| Irish | 99.5 /100 | #33 | Exceptional 48.9% |
| Immigrants | Lithuania | 99.4 /100 | #34 | Exceptional 48.8% |
| Immigrants | Northern Europe | 99.4 /100 | #35 | Exceptional 48.8% |
| Italians | 99.4 /100 | #36 | Exceptional 48.8% |
| Hungarians | 99.4 /100 | #37 | Exceptional 48.8% |
| Czechoslovakians | 99.4 /100 | #38 | Exceptional 48.8% |
| British | 99.4 /100 | #39 | Exceptional 48.8% |
| Immigrants | Canada | 99.4 /100 | #40 | Exceptional 48.8% |
| Greeks | 99.3 /100 | #41 | Exceptional 48.8% |
| Finns | 99.3 /100 | #42 | Exceptional 48.8% |
Demographics Similar to Sub-Saharan Africans by Currently Married
In terms of currently married, the demographic groups most similar to Sub-Saharan Africans are Yuman (42.6%, a difference of 0.020%), Honduran (42.5%, a difference of 0.14%), Immigrants from Guatemala (42.6%, a difference of 0.16%), Immigrants from Ghana (42.7%, a difference of 0.27%), and Paiute (42.7%, a difference of 0.28%).
| Demographics | Rating | Rank | Currently Married |
| Immigrants | Middle Africa | 0.0 /100 | #285 | Tragic 43.0% |
| Ghanaians | 0.0 /100 | #286 | Tragic 42.9% |
| Guatemalans | 0.0 /100 | #287 | Tragic 42.9% |
| Natives/Alaskans | 0.0 /100 | #288 | Tragic 42.8% |
| Paiute | 0.0 /100 | #289 | Tragic 42.7% |
| Immigrants | Ghana | 0.0 /100 | #290 | Tragic 42.7% |
| Immigrants | Guatemala | 0.0 /100 | #291 | Tragic 42.6% |
| Sub-Saharan Africans | 0.0 /100 | #292 | Tragic 42.6% |
| Yuman | 0.0 /100 | #293 | Tragic 42.6% |
| Hondurans | 0.0 /100 | #294 | Tragic 42.5% |
| Immigrants | Western Africa | 0.0 /100 | #295 | Tragic 42.4% |
| Menominee | 0.0 /100 | #296 | Tragic 42.3% |
| Cheyenne | 0.0 /100 | #297 | Tragic 42.2% |
| Immigrants | Honduras | 0.0 /100 | #298 | Tragic 42.2% |
| Liberians | 0.0 /100 | #299 | Tragic 42.2% |