Immigrants from Latvia vs Chickasaw Currently Married
COMPARE
Immigrants from Latvia
Chickasaw
Currently Married
Currently Married Comparison
Immigrants from Latvia
Chickasaw
46.7%
CURRENTLY MARRIED
56.7/ 100
METRIC RATING
170th/ 347
METRIC RANK
46.6%
CURRENTLY MARRIED
47.8/ 100
METRIC RATING
178th/ 347
METRIC RANK
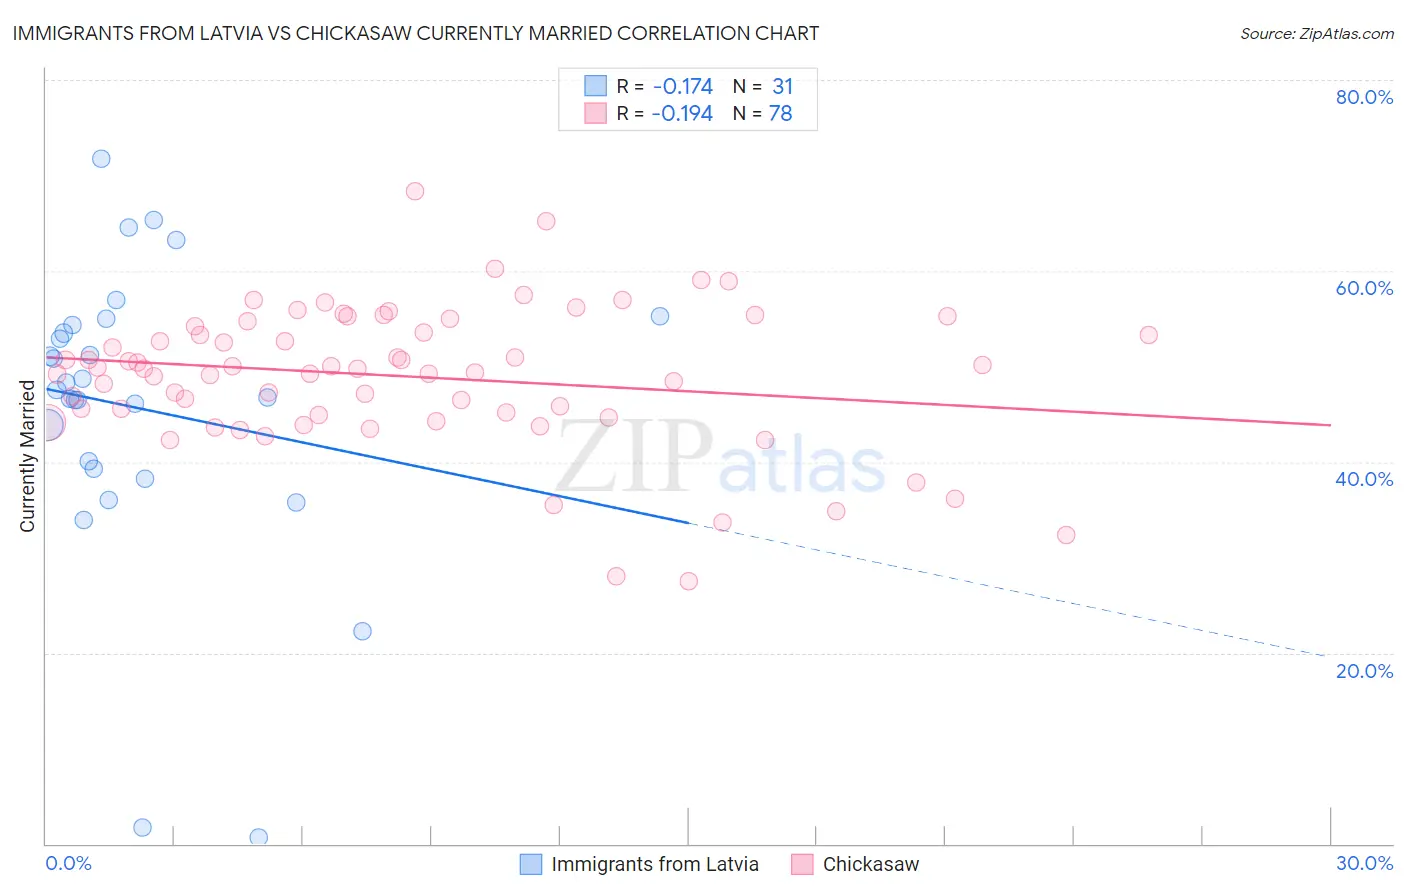
Immigrants from Latvia vs Chickasaw Currently Married Correlation Chart
The statistical analysis conducted on geographies consisting of 113,738,689 people shows a poor negative correlation between the proportion of Immigrants from Latvia and percentage of population currently married in the United States with a correlation coefficient (R) of -0.174 and weighted average of 46.7%. Similarly, the statistical analysis conducted on geographies consisting of 147,723,431 people shows a poor negative correlation between the proportion of Chickasaw and percentage of population currently married in the United States with a correlation coefficient (R) of -0.194 and weighted average of 46.6%, a difference of 0.33%.
Currently Married Correlation Summary
| Measurement | Immigrants from Latvia | Chickasaw |
| Minimum | 0.60% | 27.5% |
| Maximum | 71.8% | 68.4% |
| Range | 71.2% | 40.9% |
| Mean | 45.6% | 48.9% |
| Median | 47.6% | 49.7% |
| Interquartile 25% (IQ1) | 39.3% | 45.0% |
| Interquartile 75% (IQ3) | 54.3% | 54.2% |
| Interquartile Range (IQR) | 15.0% | 9.2% |
| Standard Deviation (Sample) | 15.6% | 7.5% |
| Standard Deviation (Population) | 15.4% | 7.4% |
Demographics Similar to Immigrants from Latvia and Chickasaw by Currently Married
In terms of currently married, the demographic groups most similar to Immigrants from Latvia are Armenian (46.8%, a difference of 0.050%), Immigrants from Afghanistan (46.8%, a difference of 0.060%), Spaniard (46.8%, a difference of 0.080%), Immigrants from Syria (46.8%, a difference of 0.10%), and Samoan (46.8%, a difference of 0.11%). Similarly, the demographic groups most similar to Chickasaw are Hawaiian (46.6%, a difference of 0.030%), Israeli (46.6%, a difference of 0.030%), Immigrants from Brazil (46.6%, a difference of 0.070%), Peruvian (46.6%, a difference of 0.080%), and Tlingit-Haida (46.7%, a difference of 0.12%).
| Demographics | Rating | Rank | Currently Married |
| Immigrants | Western Asia | 64.2 /100 | #164 | Good 46.9% |
| Samoans | 59.8 /100 | #165 | Average 46.8% |
| Immigrants | Syria | 59.3 /100 | #166 | Average 46.8% |
| Spaniards | 58.8 /100 | #167 | Average 46.8% |
| Immigrants | Afghanistan | 58.2 /100 | #168 | Average 46.8% |
| Armenians | 58.2 /100 | #169 | Average 46.8% |
| Immigrants | Latvia | 56.7 /100 | #170 | Average 46.7% |
| Immigrants | Zimbabwe | 52.4 /100 | #171 | Average 46.7% |
| Aleuts | 52.0 /100 | #172 | Average 46.7% |
| Tlingit-Haida | 51.2 /100 | #173 | Average 46.7% |
| Peruvians | 50.0 /100 | #174 | Average 46.6% |
| Immigrants | Brazil | 49.9 /100 | #175 | Average 46.6% |
| Hawaiians | 48.6 /100 | #176 | Average 46.6% |
| Israelis | 48.6 /100 | #177 | Average 46.6% |
| Chickasaw | 47.8 /100 | #178 | Average 46.6% |
| Immigrants | Oceania | 44.6 /100 | #179 | Average 46.5% |
| Costa Ricans | 43.7 /100 | #180 | Average 46.5% |
| Ottawa | 43.0 /100 | #181 | Average 46.5% |
| Potawatomi | 41.9 /100 | #182 | Average 46.5% |
| Immigrants | Northern Africa | 39.7 /100 | #183 | Fair 46.5% |
| Brazilians | 39.3 /100 | #184 | Fair 46.4% |