Immigrants from Latvia vs Northern European Currently Married
COMPARE
Immigrants from Latvia
Northern European
Currently Married
Currently Married Comparison
Immigrants from Latvia
Northern Europeans
46.7%
CURRENTLY MARRIED
56.7/ 100
METRIC RATING
170th/ 347
METRIC RANK
48.7%
CURRENTLY MARRIED
99.2/ 100
METRIC RATING
47th/ 347
METRIC RANK
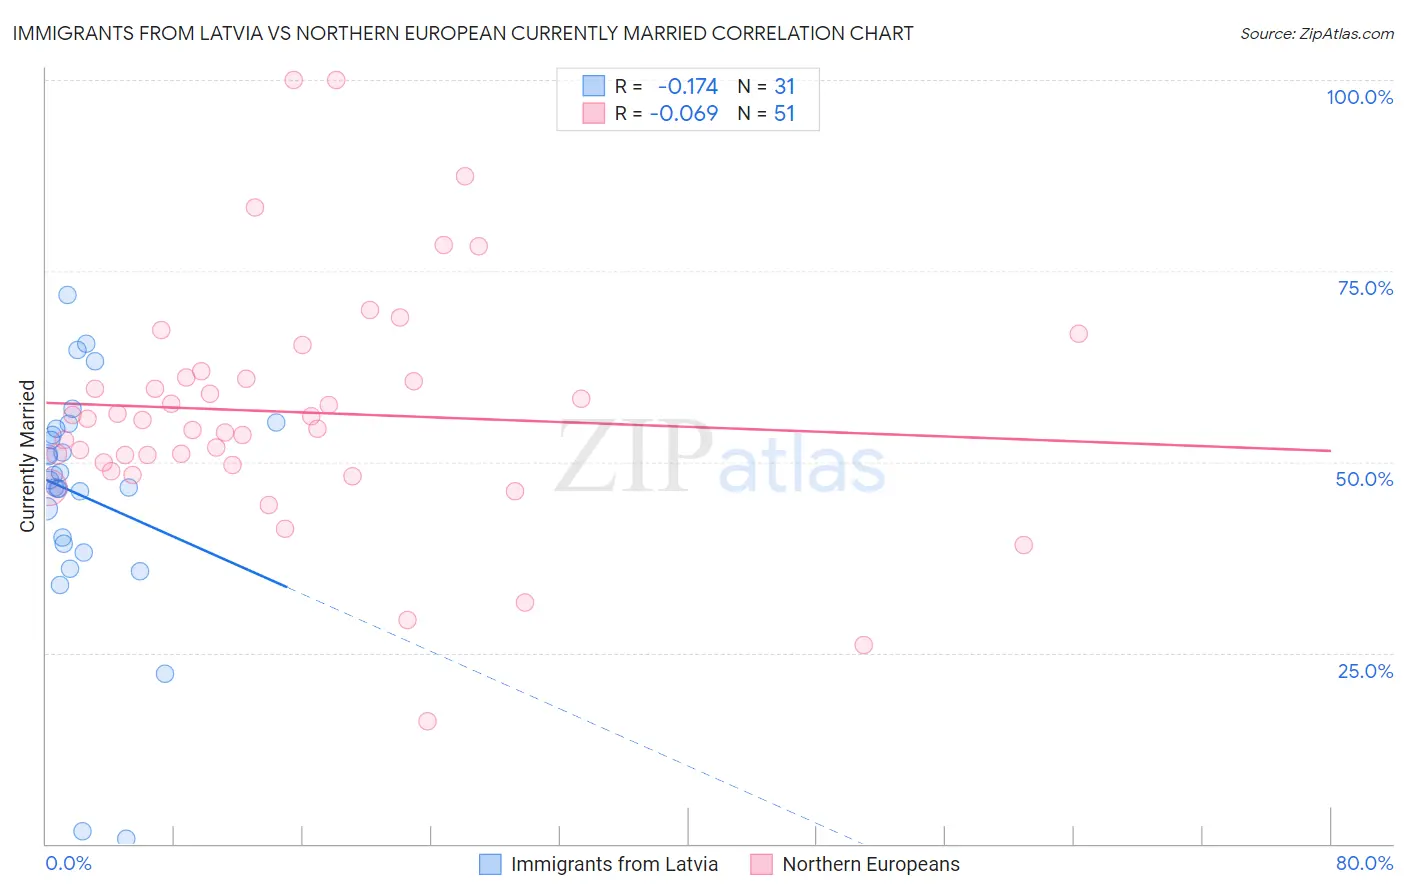
Immigrants from Latvia vs Northern European Currently Married Correlation Chart
The statistical analysis conducted on geographies consisting of 113,738,689 people shows a poor negative correlation between the proportion of Immigrants from Latvia and percentage of population currently married in the United States with a correlation coefficient (R) of -0.174 and weighted average of 46.7%. Similarly, the statistical analysis conducted on geographies consisting of 406,072,050 people shows a slight negative correlation between the proportion of Northern Europeans and percentage of population currently married in the United States with a correlation coefficient (R) of -0.069 and weighted average of 48.7%, a difference of 4.2%.
Currently Married Correlation Summary
| Measurement | Immigrants from Latvia | Northern European |
| Minimum | 0.60% | 16.1% |
| Maximum | 71.8% | 100.0% |
| Range | 71.2% | 83.9% |
| Mean | 45.6% | 56.5% |
| Median | 47.6% | 55.5% |
| Interquartile 25% (IQ1) | 39.3% | 49.5% |
| Interquartile 75% (IQ3) | 54.3% | 61.1% |
| Interquartile Range (IQR) | 15.0% | 11.6% |
| Standard Deviation (Sample) | 15.6% | 15.8% |
| Standard Deviation (Population) | 15.4% | 15.6% |
Similar Demographics by Currently Married
Demographics Similar to Immigrants from Latvia by Currently Married
In terms of currently married, the demographic groups most similar to Immigrants from Latvia are Armenian (46.8%, a difference of 0.050%), Immigrants from Afghanistan (46.8%, a difference of 0.060%), Spaniard (46.8%, a difference of 0.080%), Immigrants from Syria (46.8%, a difference of 0.10%), and Samoan (46.8%, a difference of 0.11%).
| Demographics | Rating | Rank | Currently Married |
| Delaware | 64.7 /100 | #163 | Good 46.9% |
| Immigrants | Western Asia | 64.2 /100 | #164 | Good 46.9% |
| Samoans | 59.8 /100 | #165 | Average 46.8% |
| Immigrants | Syria | 59.3 /100 | #166 | Average 46.8% |
| Spaniards | 58.8 /100 | #167 | Average 46.8% |
| Immigrants | Afghanistan | 58.2 /100 | #168 | Average 46.8% |
| Armenians | 58.2 /100 | #169 | Average 46.8% |
| Immigrants | Latvia | 56.7 /100 | #170 | Average 46.7% |
| Immigrants | Zimbabwe | 52.4 /100 | #171 | Average 46.7% |
| Aleuts | 52.0 /100 | #172 | Average 46.7% |
| Tlingit-Haida | 51.2 /100 | #173 | Average 46.7% |
| Peruvians | 50.0 /100 | #174 | Average 46.6% |
| Immigrants | Brazil | 49.9 /100 | #175 | Average 46.6% |
| Hawaiians | 48.6 /100 | #176 | Average 46.6% |
| Israelis | 48.6 /100 | #177 | Average 46.6% |
Demographics Similar to Northern Europeans by Currently Married
In terms of currently married, the demographic groups most similar to Northern Europeans are Immigrants from Iran (48.7%, a difference of 0.010%), Austrian (48.7%, a difference of 0.010%), Belgian (48.7%, a difference of 0.040%), Immigrants from North America (48.7%, a difference of 0.060%), and Scotch-Irish (48.7%, a difference of 0.090%).
| Demographics | Rating | Rank | Currently Married |
| Immigrants | Canada | 99.4 /100 | #40 | Exceptional 48.8% |
| Greeks | 99.3 /100 | #41 | Exceptional 48.8% |
| Finns | 99.3 /100 | #42 | Exceptional 48.8% |
| Scotch-Irish | 99.3 /100 | #43 | Exceptional 48.7% |
| Immigrants | North America | 99.3 /100 | #44 | Exceptional 48.7% |
| Belgians | 99.3 /100 | #45 | Exceptional 48.7% |
| Immigrants | Iran | 99.2 /100 | #46 | Exceptional 48.7% |
| Northern Europeans | 99.2 /100 | #47 | Exceptional 48.7% |
| Austrians | 99.2 /100 | #48 | Exceptional 48.7% |
| Bhutanese | 99.1 /100 | #49 | Exceptional 48.6% |
| Iranians | 99.0 /100 | #50 | Exceptional 48.6% |
| Whites/Caucasians | 99.0 /100 | #51 | Exceptional 48.6% |
| Russians | 98.9 /100 | #52 | Exceptional 48.6% |
| Immigrants | Austria | 98.8 /100 | #53 | Exceptional 48.5% |
| Immigrants | Moldova | 98.7 /100 | #54 | Exceptional 48.5% |