German vs Chickasaw Currently Married
COMPARE
German
Chickasaw
Currently Married
Currently Married Comparison
Germans
Chickasaw
49.6%
CURRENTLY MARRIED
99.9/ 100
METRIC RATING
14th/ 347
METRIC RANK
46.6%
CURRENTLY MARRIED
47.8/ 100
METRIC RATING
178th/ 347
METRIC RANK
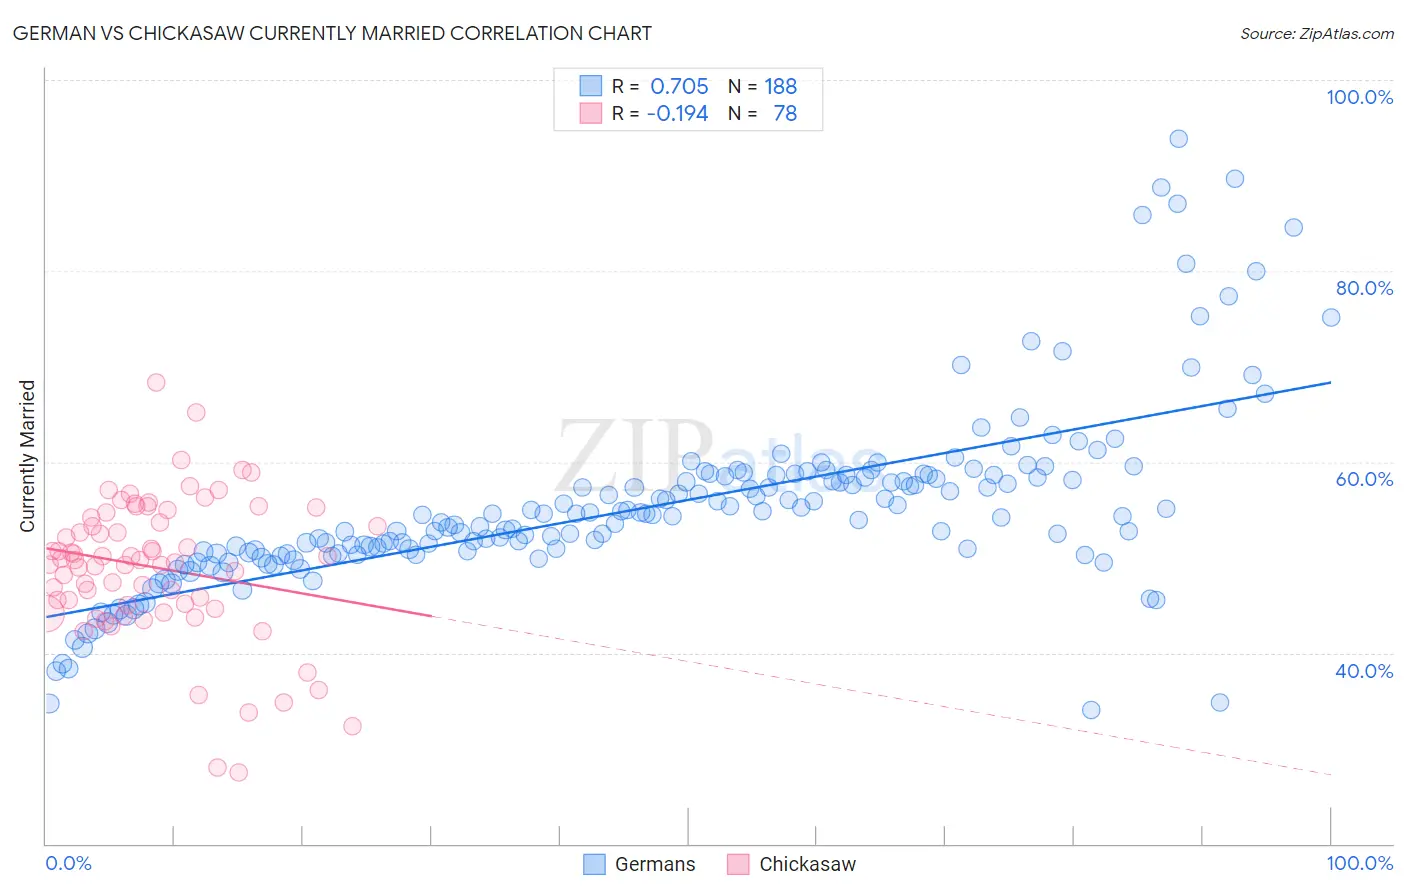
German vs Chickasaw Currently Married Correlation Chart
The statistical analysis conducted on geographies consisting of 581,146,100 people shows a strong positive correlation between the proportion of Germans and percentage of population currently married in the United States with a correlation coefficient (R) of 0.705 and weighted average of 49.6%. Similarly, the statistical analysis conducted on geographies consisting of 147,723,431 people shows a poor negative correlation between the proportion of Chickasaw and percentage of population currently married in the United States with a correlation coefficient (R) of -0.194 and weighted average of 46.6%, a difference of 6.4%.
Currently Married Correlation Summary
| Measurement | German | Chickasaw |
| Minimum | 34.0% | 27.5% |
| Maximum | 93.9% | 68.4% |
| Range | 59.9% | 40.9% |
| Mean | 55.3% | 48.9% |
| Median | 54.4% | 49.7% |
| Interquartile 25% (IQ1) | 50.4% | 45.0% |
| Interquartile 75% (IQ3) | 58.5% | 54.2% |
| Interquartile Range (IQR) | 8.2% | 9.2% |
| Standard Deviation (Sample) | 9.6% | 7.5% |
| Standard Deviation (Population) | 9.5% | 7.4% |
Similar Demographics by Currently Married
Demographics Similar to Germans by Currently Married
In terms of currently married, the demographic groups most similar to Germans are Dutch (49.6%, a difference of 0.010%), Pennsylvania German (49.6%, a difference of 0.030%), Chinese (49.5%, a difference of 0.17%), Scandinavian (49.5%, a difference of 0.19%), and English (49.7%, a difference of 0.28%).
| Demographics | Rating | Rank | Currently Married |
| Immigrants | South Central Asia | 100.0 /100 | #7 | Exceptional 50.0% |
| Swedes | 100.0 /100 | #8 | Exceptional 50.0% |
| Czechs | 99.9 /100 | #9 | Exceptional 49.9% |
| Filipinos | 99.9 /100 | #10 | Exceptional 49.7% |
| English | 99.9 /100 | #11 | Exceptional 49.7% |
| Swiss | 99.9 /100 | #12 | Exceptional 49.7% |
| Dutch | 99.9 /100 | #13 | Exceptional 49.6% |
| Germans | 99.9 /100 | #14 | Exceptional 49.6% |
| Pennsylvania Germans | 99.9 /100 | #15 | Exceptional 49.6% |
| Chinese | 99.9 /100 | #16 | Exceptional 49.5% |
| Scandinavians | 99.9 /100 | #17 | Exceptional 49.5% |
| Immigrants | Scotland | 99.8 /100 | #18 | Exceptional 49.3% |
| Europeans | 99.8 /100 | #19 | Exceptional 49.3% |
| Luxembourgers | 99.8 /100 | #20 | Exceptional 49.3% |
| Scottish | 99.8 /100 | #21 | Exceptional 49.2% |
Demographics Similar to Chickasaw by Currently Married
In terms of currently married, the demographic groups most similar to Chickasaw are Hawaiian (46.6%, a difference of 0.030%), Israeli (46.6%, a difference of 0.030%), Immigrants from Brazil (46.6%, a difference of 0.070%), Peruvian (46.6%, a difference of 0.080%), and Tlingit-Haida (46.7%, a difference of 0.12%).
| Demographics | Rating | Rank | Currently Married |
| Immigrants | Zimbabwe | 52.4 /100 | #171 | Average 46.7% |
| Aleuts | 52.0 /100 | #172 | Average 46.7% |
| Tlingit-Haida | 51.2 /100 | #173 | Average 46.7% |
| Peruvians | 50.0 /100 | #174 | Average 46.6% |
| Immigrants | Brazil | 49.9 /100 | #175 | Average 46.6% |
| Hawaiians | 48.6 /100 | #176 | Average 46.6% |
| Israelis | 48.6 /100 | #177 | Average 46.6% |
| Chickasaw | 47.8 /100 | #178 | Average 46.6% |
| Immigrants | Oceania | 44.6 /100 | #179 | Average 46.5% |
| Costa Ricans | 43.7 /100 | #180 | Average 46.5% |
| Ottawa | 43.0 /100 | #181 | Average 46.5% |
| Potawatomi | 41.9 /100 | #182 | Average 46.5% |
| Immigrants | Northern Africa | 39.7 /100 | #183 | Fair 46.5% |
| Brazilians | 39.3 /100 | #184 | Fair 46.4% |
| Mongolians | 37.6 /100 | #185 | Fair 46.4% |