Spanish vs Chickasaw Currently Married
COMPARE
Spanish
Chickasaw
Currently Married
Currently Married Comparison
Spanish
Chickasaw
47.0%
CURRENTLY MARRIED
68.1/ 100
METRIC RATING
156th/ 347
METRIC RANK
46.6%
CURRENTLY MARRIED
47.8/ 100
METRIC RATING
178th/ 347
METRIC RANK
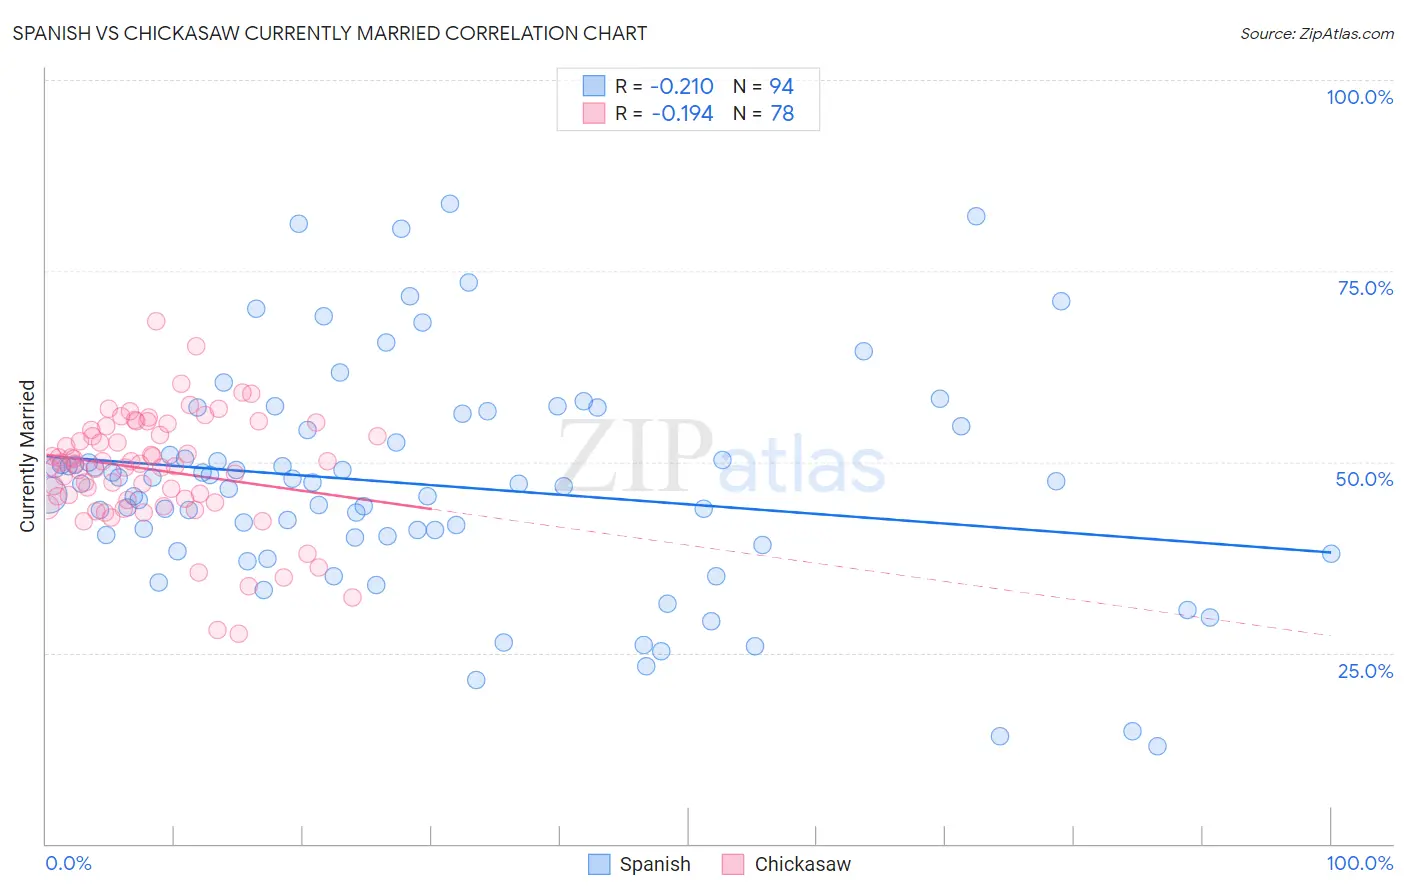
Spanish vs Chickasaw Currently Married Correlation Chart
The statistical analysis conducted on geographies consisting of 422,154,276 people shows a weak negative correlation between the proportion of Spanish and percentage of population currently married in the United States with a correlation coefficient (R) of -0.210 and weighted average of 47.0%. Similarly, the statistical analysis conducted on geographies consisting of 147,723,431 people shows a poor negative correlation between the proportion of Chickasaw and percentage of population currently married in the United States with a correlation coefficient (R) of -0.194 and weighted average of 46.6%, a difference of 0.77%.
Currently Married Correlation Summary
| Measurement | Spanish | Chickasaw |
| Minimum | 12.8% | 27.5% |
| Maximum | 83.7% | 68.4% |
| Range | 70.9% | 40.9% |
| Mean | 47.0% | 48.9% |
| Median | 47.2% | 49.7% |
| Interquartile 25% (IQ1) | 40.1% | 45.0% |
| Interquartile 75% (IQ3) | 54.2% | 54.2% |
| Interquartile Range (IQR) | 14.1% | 9.2% |
| Standard Deviation (Sample) | 14.5% | 7.5% |
| Standard Deviation (Population) | 14.4% | 7.4% |
Similar Demographics by Currently Married
Demographics Similar to Spanish by Currently Married
In terms of currently married, the demographic groups most similar to Spanish are Immigrants from Switzerland (46.9%, a difference of 0.010%), Immigrants from Venezuela (47.0%, a difference of 0.020%), Albanian (47.0%, a difference of 0.020%), Arab (47.0%, a difference of 0.020%), and Immigrants from Serbia (47.0%, a difference of 0.030%).
| Demographics | Rating | Rank | Currently Married |
| Zimbabweans | 70.1 /100 | #149 | Good 47.0% |
| Immigrants | Turkey | 70.0 /100 | #150 | Good 47.0% |
| Chileans | 69.8 /100 | #151 | Good 47.0% |
| Immigrants | Serbia | 68.8 /100 | #152 | Good 47.0% |
| Immigrants | Venezuela | 68.6 /100 | #153 | Good 47.0% |
| Albanians | 68.6 /100 | #154 | Good 47.0% |
| Arabs | 68.6 /100 | #155 | Good 47.0% |
| Spanish | 68.1 /100 | #156 | Good 47.0% |
| Immigrants | Switzerland | 67.8 /100 | #157 | Good 46.9% |
| Cherokee | 66.8 /100 | #158 | Good 46.9% |
| Iraqis | 66.4 /100 | #159 | Good 46.9% |
| Immigrants | Uzbekistan | 66.0 /100 | #160 | Good 46.9% |
| Immigrants | Southern Europe | 65.9 /100 | #161 | Good 46.9% |
| Immigrants | Nonimmigrants | 65.4 /100 | #162 | Good 46.9% |
| Delaware | 64.7 /100 | #163 | Good 46.9% |
Demographics Similar to Chickasaw by Currently Married
In terms of currently married, the demographic groups most similar to Chickasaw are Hawaiian (46.6%, a difference of 0.030%), Israeli (46.6%, a difference of 0.030%), Immigrants from Brazil (46.6%, a difference of 0.070%), Peruvian (46.6%, a difference of 0.080%), and Tlingit-Haida (46.7%, a difference of 0.12%).
| Demographics | Rating | Rank | Currently Married |
| Immigrants | Zimbabwe | 52.4 /100 | #171 | Average 46.7% |
| Aleuts | 52.0 /100 | #172 | Average 46.7% |
| Tlingit-Haida | 51.2 /100 | #173 | Average 46.7% |
| Peruvians | 50.0 /100 | #174 | Average 46.6% |
| Immigrants | Brazil | 49.9 /100 | #175 | Average 46.6% |
| Hawaiians | 48.6 /100 | #176 | Average 46.6% |
| Israelis | 48.6 /100 | #177 | Average 46.6% |
| Chickasaw | 47.8 /100 | #178 | Average 46.6% |
| Immigrants | Oceania | 44.6 /100 | #179 | Average 46.5% |
| Costa Ricans | 43.7 /100 | #180 | Average 46.5% |
| Ottawa | 43.0 /100 | #181 | Average 46.5% |
| Potawatomi | 41.9 /100 | #182 | Average 46.5% |
| Immigrants | Northern Africa | 39.7 /100 | #183 | Fair 46.5% |
| Brazilians | 39.3 /100 | #184 | Fair 46.4% |
| Mongolians | 37.6 /100 | #185 | Fair 46.4% |