Immigrants from Latvia vs Chickasaw Disability Age Under 5
COMPARE
Immigrants from Latvia
Chickasaw
Disability Age Under 5
Disability Age Under 5 Comparison
Immigrants from Latvia
Chickasaw
1.2%
DISABILITY AGE UNDER 5
50.0/ 100
METRIC RATING
174th/ 347
METRIC RANK
1.7%
DISABILITY AGE UNDER 5
0.0/ 100
METRIC RATING
323rd/ 347
METRIC RANK
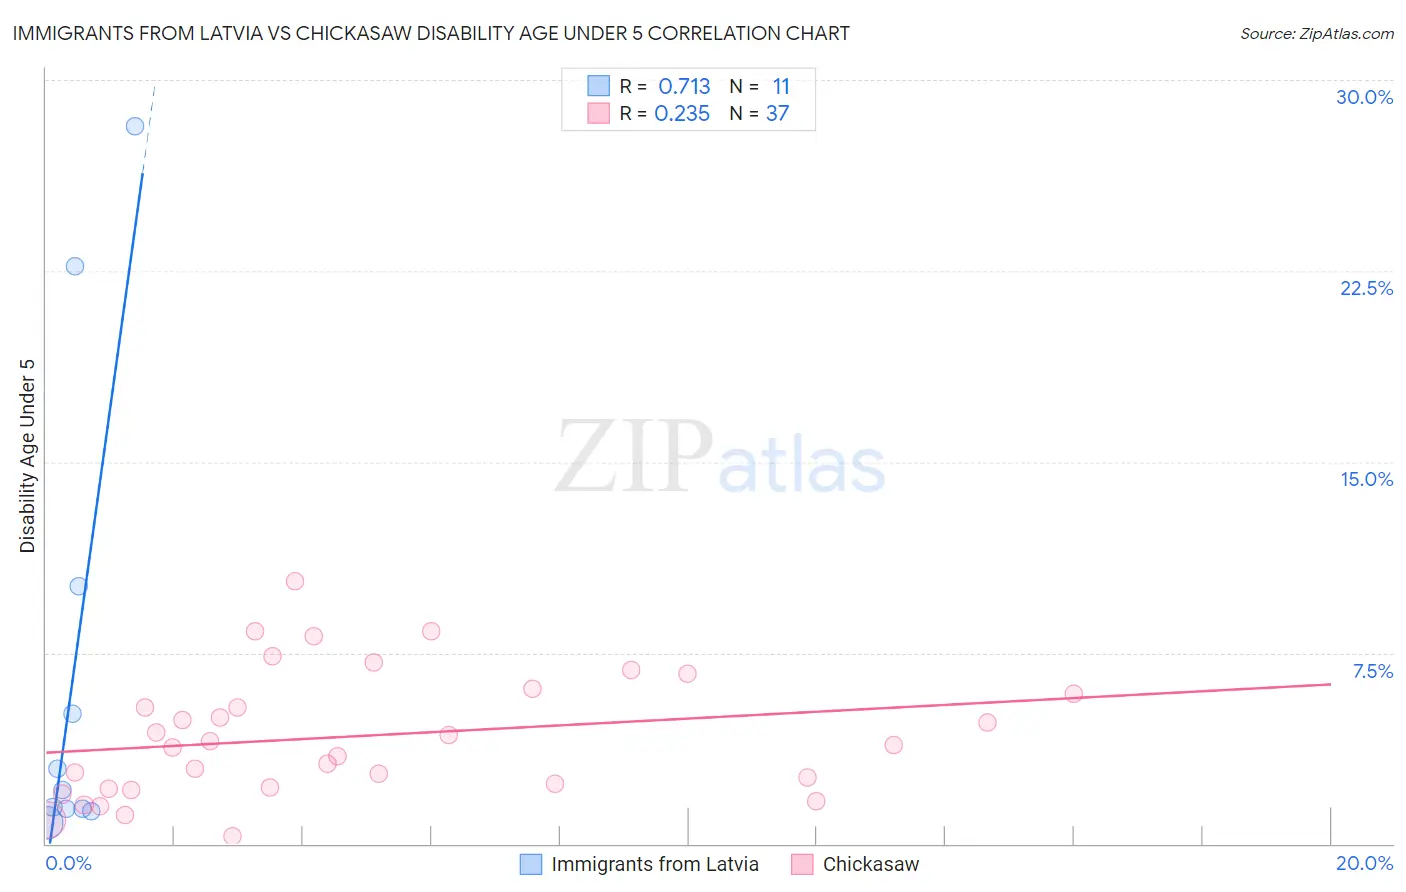
Immigrants from Latvia vs Chickasaw Disability Age Under 5 Correlation Chart
The statistical analysis conducted on geographies consisting of 82,600,960 people shows a strong positive correlation between the proportion of Immigrants from Latvia and percentage of population with a disability under the age of 5 in the United States with a correlation coefficient (R) of 0.713 and weighted average of 1.2%. Similarly, the statistical analysis conducted on geographies consisting of 108,085,172 people shows a weak positive correlation between the proportion of Chickasaw and percentage of population with a disability under the age of 5 in the United States with a correlation coefficient (R) of 0.235 and weighted average of 1.7%, a difference of 40.3%.
Disability Age Under 5 Correlation Summary
| Measurement | Immigrants from Latvia | Chickasaw |
| Minimum | 0.83% | 0.31% |
| Maximum | 28.2% | 10.3% |
| Range | 27.3% | 10.0% |
| Mean | 7.0% | 4.2% |
| Median | 2.1% | 3.9% |
| Interquartile 25% (IQ1) | 1.4% | 2.2% |
| Interquartile 75% (IQ3) | 10.1% | 6.0% |
| Interquartile Range (IQR) | 8.8% | 3.8% |
| Standard Deviation (Sample) | 9.6% | 2.5% |
| Standard Deviation (Population) | 9.1% | 2.4% |
Similar Demographics by Disability Age Under 5
Demographics Similar to Immigrants from Latvia by Disability Age Under 5
In terms of disability age under 5, the demographic groups most similar to Immigrants from Latvia are Immigrants from Nigeria (1.2%, a difference of 0.0%), Immigrants from Ireland (1.2%, a difference of 0.020%), Crow (1.2%, a difference of 0.090%), Immigrants from Kenya (1.2%, a difference of 0.13%), and Comanche (1.2%, a difference of 0.22%).
| Demographics | Rating | Rank | Disability Age Under 5 |
| Immigrants | Argentina | 60.2 /100 | #167 | Good 1.2% |
| Sierra Leoneans | 59.1 /100 | #168 | Average 1.2% |
| Immigrants | Uruguay | 59.0 /100 | #169 | Average 1.2% |
| Immigrants | Jamaica | 58.8 /100 | #170 | Average 1.2% |
| Guamanians/Chamorros | 57.8 /100 | #171 | Average 1.2% |
| Crow | 51.0 /100 | #172 | Average 1.2% |
| Immigrants | Ireland | 50.3 /100 | #173 | Average 1.2% |
| Immigrants | Latvia | 50.0 /100 | #174 | Average 1.2% |
| Immigrants | Nigeria | 50.0 /100 | #175 | Average 1.2% |
| Immigrants | Kenya | 48.6 /100 | #176 | Average 1.2% |
| Comanche | 47.5 /100 | #177 | Average 1.2% |
| Venezuelans | 47.1 /100 | #178 | Average 1.2% |
| Immigrants | Bahamas | 45.2 /100 | #179 | Average 1.2% |
| Immigrants | Mexico | 44.4 /100 | #180 | Average 1.2% |
| Immigrants | Peru | 43.7 /100 | #181 | Average 1.2% |
| Macedonians | 43.7 /100 | #181 | Average 1.2% |
Demographics Similar to Chickasaw by Disability Age Under 5
In terms of disability age under 5, the demographic groups most similar to Chickasaw are German (1.7%, a difference of 1.1%), Ottawa (1.7%, a difference of 1.7%), Scotch-Irish (1.7%, a difference of 1.8%), Cherokee (1.8%, a difference of 1.8%), and Slovak (1.7%, a difference of 2.3%).
| Demographics | Rating | Rank | Disability Age Under 5 |
| Immigrants | Cabo Verde | 0.0 /100 | #316 | Tragic 1.7% |
| French | 0.0 /100 | #317 | Tragic 1.7% |
| Irish | 0.0 /100 | #318 | Tragic 1.7% |
| Slovaks | 0.0 /100 | #319 | Tragic 1.7% |
| Scotch-Irish | 0.0 /100 | #320 | Tragic 1.7% |
| Ottawa | 0.0 /100 | #321 | Tragic 1.7% |
| Germans | 0.0 /100 | #322 | Tragic 1.7% |
| Chickasaw | 0.0 /100 | #323 | Tragic 1.7% |
| Cherokee | 0.0 /100 | #324 | Tragic 1.8% |
| Immigrants | Portugal | 0.0 /100 | #325 | Tragic 1.8% |
| Sioux | 0.0 /100 | #326 | Tragic 1.8% |
| Osage | 0.0 /100 | #327 | Tragic 1.8% |
| Americans | 0.0 /100 | #328 | Tragic 1.9% |
| Houma | 0.0 /100 | #329 | Tragic 1.9% |
| Choctaw | 0.0 /100 | #330 | Tragic 1.9% |