Scandinavian vs Immigrants from Bangladesh College, 1 year or more
COMPARE
Scandinavian
Immigrants from Bangladesh
College, 1 year or more
College, 1 year or more Comparison
Scandinavians
Immigrants from Bangladesh
61.0%
COLLEGE, 1 YEAR OR MORE
88.2/ 100
METRIC RATING
132nd/ 347
METRIC RANK
56.6%
COLLEGE, 1 YEAR OR MORE
2.6/ 100
METRIC RATING
232nd/ 347
METRIC RANK
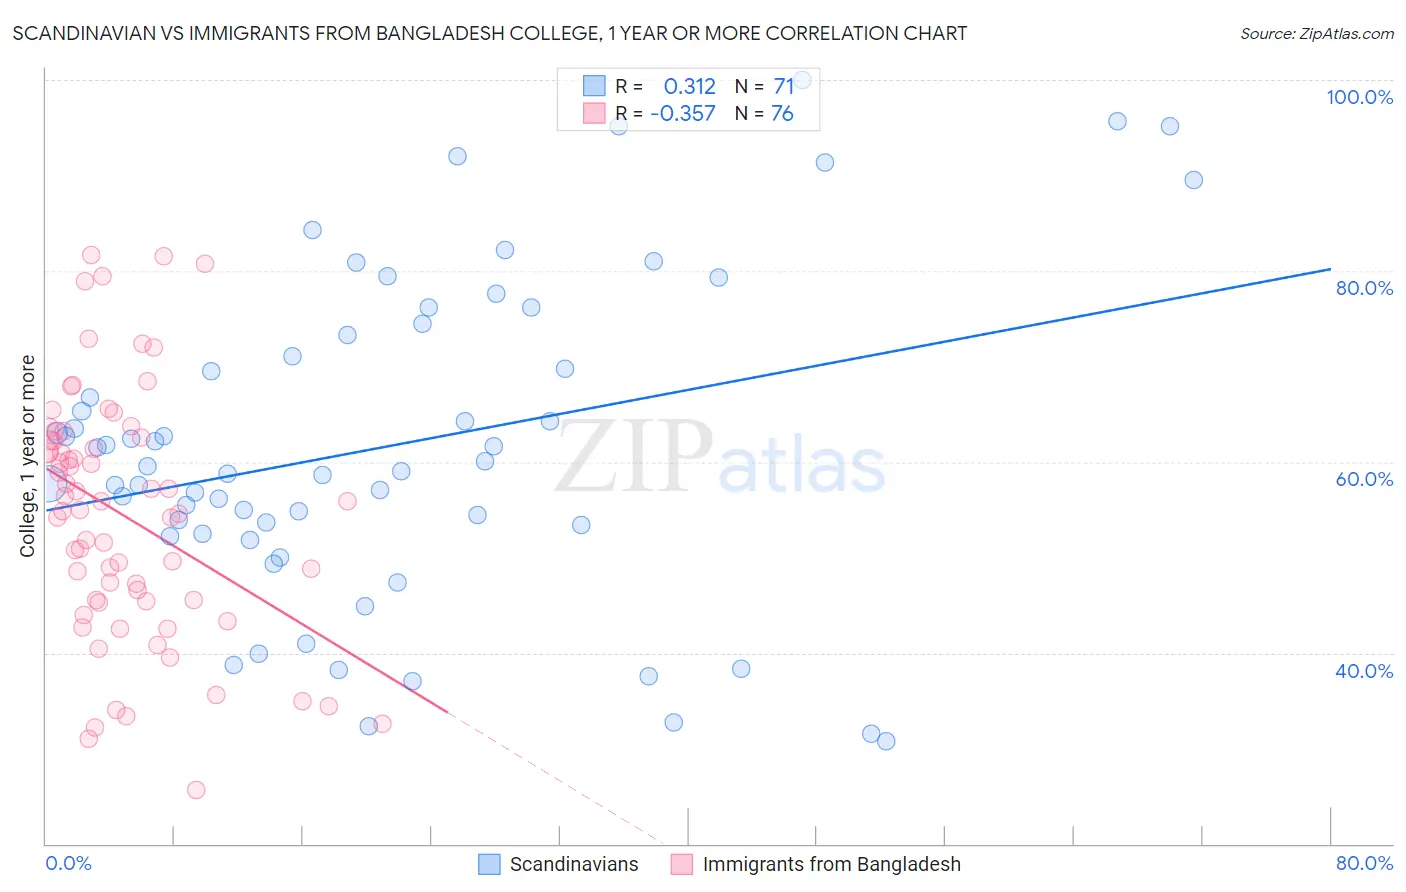
Scandinavian vs Immigrants from Bangladesh College, 1 year or more Correlation Chart
The statistical analysis conducted on geographies consisting of 472,656,557 people shows a mild positive correlation between the proportion of Scandinavians and percentage of population with at least college, 1 year or more education in the United States with a correlation coefficient (R) of 0.312 and weighted average of 61.0%. Similarly, the statistical analysis conducted on geographies consisting of 203,680,191 people shows a mild negative correlation between the proportion of Immigrants from Bangladesh and percentage of population with at least college, 1 year or more education in the United States with a correlation coefficient (R) of -0.357 and weighted average of 56.6%, a difference of 7.9%.
College, 1 year or more Correlation Summary
| Measurement | Scandinavian | Immigrants from Bangladesh |
| Minimum | 30.8% | 25.6% |
| Maximum | 100.0% | 81.7% |
| Range | 69.2% | 56.1% |
| Mean | 61.7% | 54.4% |
| Median | 59.5% | 55.4% |
| Interquartile 25% (IQ1) | 52.4% | 45.5% |
| Interquartile 75% (IQ3) | 73.2% | 62.4% |
| Interquartile Range (IQR) | 20.8% | 16.9% |
| Standard Deviation (Sample) | 16.9% | 12.9% |
| Standard Deviation (Population) | 16.7% | 12.8% |
Similar Demographics by College, 1 year or more
Demographics Similar to Scandinavians by College, 1 year or more
In terms of college, 1 year or more, the demographic groups most similar to Scandinavians are Immigrants from Uzbekistan (61.0%, a difference of 0.030%), Immigrants from Venezuela (61.0%, a difference of 0.040%), Immigrants from Uganda (60.9%, a difference of 0.10%), Basque (60.9%, a difference of 0.12%), and Immigrants from Morocco (61.1%, a difference of 0.16%).
| Demographics | Rating | Rank | College, 1 year or more |
| Immigrants | Syria | 91.6 /100 | #125 | Exceptional 61.3% |
| Alsatians | 91.3 /100 | #126 | Exceptional 61.3% |
| Immigrants | Eastern Africa | 91.1 /100 | #127 | Exceptional 61.2% |
| Immigrants | Italy | 91.1 /100 | #128 | Exceptional 61.2% |
| Ugandans | 90.7 /100 | #129 | Exceptional 61.2% |
| Italians | 89.5 /100 | #130 | Excellent 61.1% |
| Immigrants | Morocco | 89.5 /100 | #131 | Excellent 61.1% |
| Scandinavians | 88.2 /100 | #132 | Excellent 61.0% |
| Immigrants | Uzbekistan | 88.0 /100 | #133 | Excellent 61.0% |
| Immigrants | Venezuela | 87.9 /100 | #134 | Excellent 61.0% |
| Immigrants | Uganda | 87.4 /100 | #135 | Excellent 60.9% |
| Basques | 87.2 /100 | #136 | Excellent 60.9% |
| Slovenes | 86.5 /100 | #137 | Excellent 60.9% |
| Taiwanese | 84.3 /100 | #138 | Excellent 60.7% |
| Immigrants | Eritrea | 84.3 /100 | #139 | Excellent 60.7% |
Demographics Similar to Immigrants from Bangladesh by College, 1 year or more
In terms of college, 1 year or more, the demographic groups most similar to Immigrants from Bangladesh are Immigrants from Burma/Myanmar (56.6%, a difference of 0.060%), Nonimmigrants (56.5%, a difference of 0.090%), Liberian (56.7%, a difference of 0.25%), Cree (56.8%, a difference of 0.47%), and Spanish American (56.3%, a difference of 0.54%).
| Demographics | Rating | Rank | College, 1 year or more |
| Vietnamese | 4.7 /100 | #225 | Tragic 57.0% |
| Immigrants | Western Africa | 4.6 /100 | #226 | Tragic 57.0% |
| Immigrants | Immigrants | 4.4 /100 | #227 | Tragic 57.0% |
| Immigrants | Fiji | 4.0 /100 | #228 | Tragic 56.9% |
| Cree | 3.6 /100 | #229 | Tragic 56.8% |
| Liberians | 3.1 /100 | #230 | Tragic 56.7% |
| Immigrants | Burma/Myanmar | 2.7 /100 | #231 | Tragic 56.6% |
| Immigrants | Bangladesh | 2.6 /100 | #232 | Tragic 56.6% |
| Immigrants | Nonimmigrants | 2.5 /100 | #233 | Tragic 56.5% |
| Spanish Americans | 1.8 /100 | #234 | Tragic 56.3% |
| West Indians | 1.8 /100 | #235 | Tragic 56.3% |
| Iroquois | 1.7 /100 | #236 | Tragic 56.2% |
| Samoans | 1.6 /100 | #237 | Tragic 56.2% |
| Barbadians | 1.3 /100 | #238 | Tragic 56.0% |
| Puget Sound Salish | 1.1 /100 | #239 | Tragic 55.9% |