Scandinavian vs Immigrants from Singapore College, 1 year or more
COMPARE
Scandinavian
Immigrants from Singapore
College, 1 year or more
College, 1 year or more Comparison
Scandinavians
Immigrants from Singapore
61.0%
COLLEGE, 1 YEAR OR MORE
88.2/ 100
METRIC RATING
132nd/ 347
METRIC RANK
70.1%
COLLEGE, 1 YEAR OR MORE
100.0/ 100
METRIC RATING
2nd/ 347
METRIC RANK
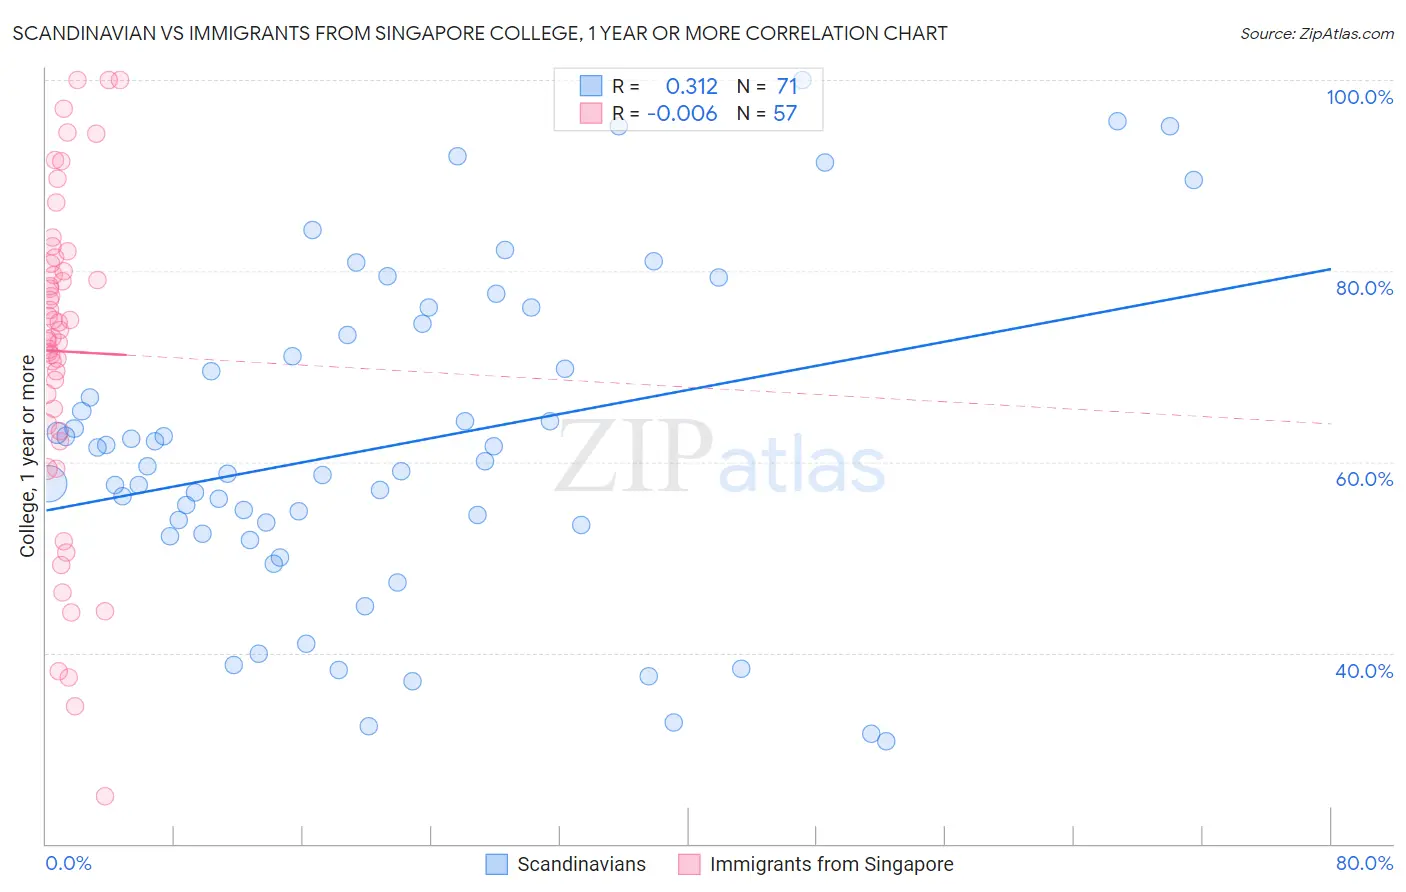
Scandinavian vs Immigrants from Singapore College, 1 year or more Correlation Chart
The statistical analysis conducted on geographies consisting of 472,656,557 people shows a mild positive correlation between the proportion of Scandinavians and percentage of population with at least college, 1 year or more education in the United States with a correlation coefficient (R) of 0.312 and weighted average of 61.0%. Similarly, the statistical analysis conducted on geographies consisting of 137,521,700 people shows no correlation between the proportion of Immigrants from Singapore and percentage of population with at least college, 1 year or more education in the United States with a correlation coefficient (R) of -0.006 and weighted average of 70.1%, a difference of 15.0%.
College, 1 year or more Correlation Summary
| Measurement | Scandinavian | Immigrants from Singapore |
| Minimum | 30.8% | 24.9% |
| Maximum | 100.0% | 100.0% |
| Range | 69.2% | 75.1% |
| Mean | 61.7% | 71.6% |
| Median | 59.5% | 73.8% |
| Interquartile 25% (IQ1) | 52.4% | 63.6% |
| Interquartile 75% (IQ3) | 73.2% | 81.1% |
| Interquartile Range (IQR) | 20.8% | 17.5% |
| Standard Deviation (Sample) | 16.9% | 17.1% |
| Standard Deviation (Population) | 16.7% | 17.0% |
Similar Demographics by College, 1 year or more
Demographics Similar to Scandinavians by College, 1 year or more
In terms of college, 1 year or more, the demographic groups most similar to Scandinavians are Immigrants from Uzbekistan (61.0%, a difference of 0.030%), Immigrants from Venezuela (61.0%, a difference of 0.040%), Immigrants from Uganda (60.9%, a difference of 0.10%), Basque (60.9%, a difference of 0.12%), and Immigrants from Morocco (61.1%, a difference of 0.16%).
| Demographics | Rating | Rank | College, 1 year or more |
| Immigrants | Syria | 91.6 /100 | #125 | Exceptional 61.3% |
| Alsatians | 91.3 /100 | #126 | Exceptional 61.3% |
| Immigrants | Eastern Africa | 91.1 /100 | #127 | Exceptional 61.2% |
| Immigrants | Italy | 91.1 /100 | #128 | Exceptional 61.2% |
| Ugandans | 90.7 /100 | #129 | Exceptional 61.2% |
| Italians | 89.5 /100 | #130 | Excellent 61.1% |
| Immigrants | Morocco | 89.5 /100 | #131 | Excellent 61.1% |
| Scandinavians | 88.2 /100 | #132 | Excellent 61.0% |
| Immigrants | Uzbekistan | 88.0 /100 | #133 | Excellent 61.0% |
| Immigrants | Venezuela | 87.9 /100 | #134 | Excellent 61.0% |
| Immigrants | Uganda | 87.4 /100 | #135 | Excellent 60.9% |
| Basques | 87.2 /100 | #136 | Excellent 60.9% |
| Slovenes | 86.5 /100 | #137 | Excellent 60.9% |
| Taiwanese | 84.3 /100 | #138 | Excellent 60.7% |
| Immigrants | Eritrea | 84.3 /100 | #139 | Excellent 60.7% |
Demographics Similar to Immigrants from Singapore by College, 1 year or more
In terms of college, 1 year or more, the demographic groups most similar to Immigrants from Singapore are Iranian (70.0%, a difference of 0.22%), Immigrants from Taiwan (69.6%, a difference of 0.72%), Immigrants from India (69.6%, a difference of 0.72%), Immigrants from Iran (69.5%, a difference of 0.92%), and Filipino (71.0%, a difference of 1.2%).
| Demographics | Rating | Rank | College, 1 year or more |
| Filipinos | 100.0 /100 | #1 | Exceptional 71.0% |
| Immigrants | Singapore | 100.0 /100 | #2 | Exceptional 70.1% |
| Iranians | 100.0 /100 | #3 | Exceptional 70.0% |
| Immigrants | Taiwan | 100.0 /100 | #4 | Exceptional 69.6% |
| Immigrants | India | 100.0 /100 | #5 | Exceptional 69.6% |
| Immigrants | Iran | 100.0 /100 | #6 | Exceptional 69.5% |
| Okinawans | 100.0 /100 | #7 | Exceptional 69.0% |
| Thais | 100.0 /100 | #8 | Exceptional 68.6% |
| Immigrants | Israel | 100.0 /100 | #9 | Exceptional 67.8% |
| Immigrants | Australia | 100.0 /100 | #10 | Exceptional 67.7% |
| Immigrants | South Central Asia | 100.0 /100 | #11 | Exceptional 67.1% |
| Cypriots | 100.0 /100 | #12 | Exceptional 67.0% |
| Immigrants | Sweden | 100.0 /100 | #13 | Exceptional 66.8% |
| Burmese | 100.0 /100 | #14 | Exceptional 66.7% |
| Cambodians | 100.0 /100 | #15 | Exceptional 66.7% |