Hungarian vs Scandinavian College, 1 year or more
COMPARE
Hungarian
Scandinavian
College, 1 year or more
College, 1 year or more Comparison
Hungarians
Scandinavians
59.5%
COLLEGE, 1 YEAR OR MORE
52.9/ 100
METRIC RATING
168th/ 347
METRIC RANK
61.0%
COLLEGE, 1 YEAR OR MORE
88.2/ 100
METRIC RATING
132nd/ 347
METRIC RANK
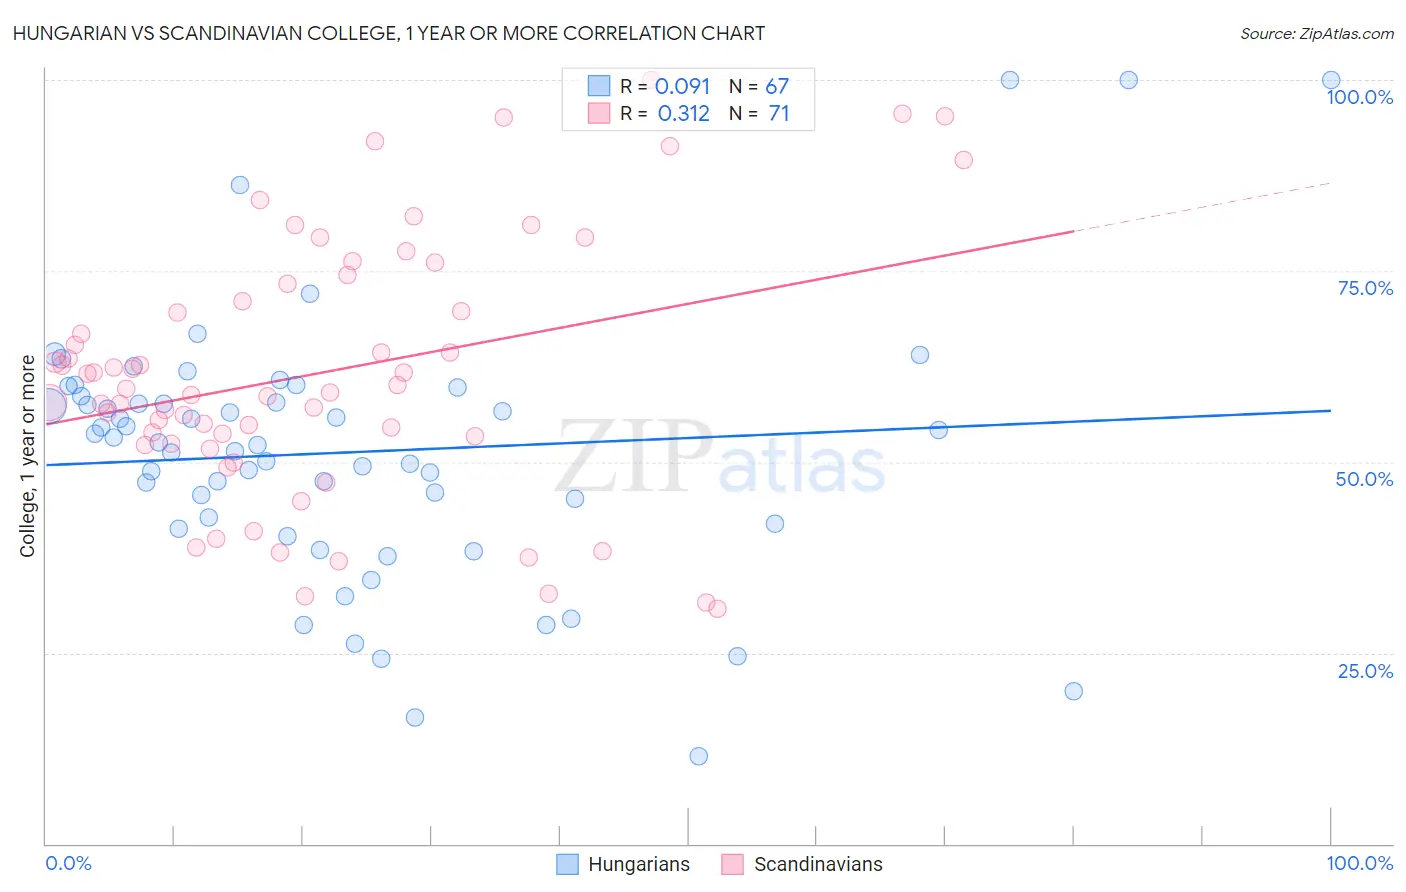
Hungarian vs Scandinavian College, 1 year or more Correlation Chart
The statistical analysis conducted on geographies consisting of 486,237,030 people shows a slight positive correlation between the proportion of Hungarians and percentage of population with at least college, 1 year or more education in the United States with a correlation coefficient (R) of 0.091 and weighted average of 59.5%. Similarly, the statistical analysis conducted on geographies consisting of 472,656,557 people shows a mild positive correlation between the proportion of Scandinavians and percentage of population with at least college, 1 year or more education in the United States with a correlation coefficient (R) of 0.312 and weighted average of 61.0%, a difference of 2.5%.
College, 1 year or more Correlation Summary
| Measurement | Hungarian | Scandinavian |
| Minimum | 11.5% | 30.8% |
| Maximum | 100.0% | 100.0% |
| Range | 88.5% | 69.2% |
| Mean | 51.3% | 61.7% |
| Median | 52.6% | 59.5% |
| Interquartile 25% (IQ1) | 41.8% | 52.4% |
| Interquartile 75% (IQ3) | 58.5% | 73.2% |
| Interquartile Range (IQR) | 16.7% | 20.8% |
| Standard Deviation (Sample) | 17.2% | 16.9% |
| Standard Deviation (Population) | 17.1% | 16.7% |
Similar Demographics by College, 1 year or more
Demographics Similar to Hungarians by College, 1 year or more
In terms of college, 1 year or more, the demographic groups most similar to Hungarians are Immigrants from North Macedonia (59.5%, a difference of 0.010%), Immigrants from Southern Europe (59.5%, a difference of 0.010%), Welsh (59.5%, a difference of 0.030%), Immigrants from Albania (59.5%, a difference of 0.030%), and Immigrants from Sierra Leone (59.5%, a difference of 0.040%).
| Demographics | Rating | Rank | College, 1 year or more |
| Somalis | 64.5 /100 | #161 | Good 59.9% |
| Koreans | 58.5 /100 | #162 | Average 59.7% |
| Immigrants | Somalia | 58.3 /100 | #163 | Average 59.7% |
| Belgians | 58.1 /100 | #164 | Average 59.7% |
| Irish | 56.1 /100 | #165 | Average 59.6% |
| Immigrants | Africa | 56.1 /100 | #166 | Average 59.6% |
| Immigrants | North Macedonia | 53.1 /100 | #167 | Average 59.5% |
| Hungarians | 52.9 /100 | #168 | Average 59.5% |
| Immigrants | Southern Europe | 52.7 /100 | #169 | Average 59.5% |
| Welsh | 52.4 /100 | #170 | Average 59.5% |
| Immigrants | Albania | 52.3 /100 | #171 | Average 59.5% |
| Immigrants | Sierra Leone | 52.2 /100 | #172 | Average 59.5% |
| Immigrants | Oceania | 51.2 /100 | #173 | Average 59.4% |
| Celtics | 50.0 /100 | #174 | Average 59.4% |
| Sri Lankans | 49.0 /100 | #175 | Average 59.4% |
Demographics Similar to Scandinavians by College, 1 year or more
In terms of college, 1 year or more, the demographic groups most similar to Scandinavians are Immigrants from Uzbekistan (61.0%, a difference of 0.030%), Immigrants from Venezuela (61.0%, a difference of 0.040%), Immigrants from Uganda (60.9%, a difference of 0.10%), Basque (60.9%, a difference of 0.12%), and Immigrants from Morocco (61.1%, a difference of 0.16%).
| Demographics | Rating | Rank | College, 1 year or more |
| Immigrants | Syria | 91.6 /100 | #125 | Exceptional 61.3% |
| Alsatians | 91.3 /100 | #126 | Exceptional 61.3% |
| Immigrants | Eastern Africa | 91.1 /100 | #127 | Exceptional 61.2% |
| Immigrants | Italy | 91.1 /100 | #128 | Exceptional 61.2% |
| Ugandans | 90.7 /100 | #129 | Exceptional 61.2% |
| Italians | 89.5 /100 | #130 | Excellent 61.1% |
| Immigrants | Morocco | 89.5 /100 | #131 | Excellent 61.1% |
| Scandinavians | 88.2 /100 | #132 | Excellent 61.0% |
| Immigrants | Uzbekistan | 88.0 /100 | #133 | Excellent 61.0% |
| Immigrants | Venezuela | 87.9 /100 | #134 | Excellent 61.0% |
| Immigrants | Uganda | 87.4 /100 | #135 | Excellent 60.9% |
| Basques | 87.2 /100 | #136 | Excellent 60.9% |
| Slovenes | 86.5 /100 | #137 | Excellent 60.9% |
| Taiwanese | 84.3 /100 | #138 | Excellent 60.7% |
| Immigrants | Eritrea | 84.3 /100 | #139 | Excellent 60.7% |