Hungarian vs Alaskan Athabascan College, 1 year or more
COMPARE
Hungarian
Alaskan Athabascan
College, 1 year or more
College, 1 year or more Comparison
Hungarians
Alaskan Athabascans
59.5%
COLLEGE, 1 YEAR OR MORE
52.9/ 100
METRIC RATING
168th/ 347
METRIC RANK
53.4%
COLLEGE, 1 YEAR OR MORE
0.0/ 100
METRIC RATING
290th/ 347
METRIC RANK
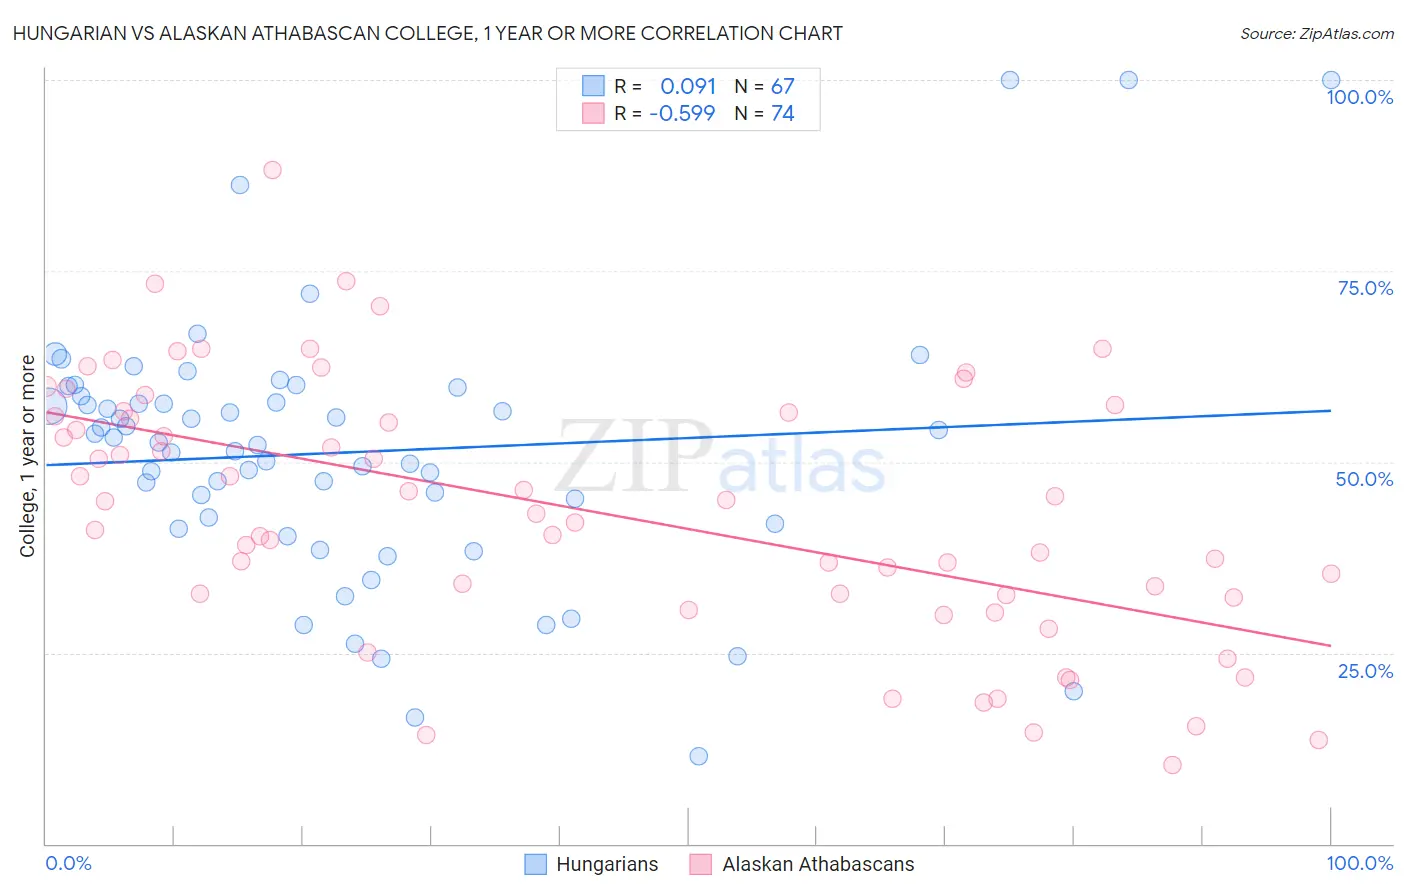
Hungarian vs Alaskan Athabascan College, 1 year or more Correlation Chart
The statistical analysis conducted on geographies consisting of 486,237,030 people shows a slight positive correlation between the proportion of Hungarians and percentage of population with at least college, 1 year or more education in the United States with a correlation coefficient (R) of 0.091 and weighted average of 59.5%. Similarly, the statistical analysis conducted on geographies consisting of 45,820,330 people shows a substantial negative correlation between the proportion of Alaskan Athabascans and percentage of population with at least college, 1 year or more education in the United States with a correlation coefficient (R) of -0.599 and weighted average of 53.4%, a difference of 11.4%.
College, 1 year or more Correlation Summary
| Measurement | Hungarian | Alaskan Athabascan |
| Minimum | 11.5% | 10.3% |
| Maximum | 100.0% | 88.2% |
| Range | 88.5% | 77.9% |
| Mean | 51.3% | 43.6% |
| Median | 52.6% | 44.1% |
| Interquartile 25% (IQ1) | 41.8% | 32.5% |
| Interquartile 75% (IQ3) | 58.5% | 56.5% |
| Interquartile Range (IQR) | 16.7% | 24.0% |
| Standard Deviation (Sample) | 17.2% | 16.8% |
| Standard Deviation (Population) | 17.1% | 16.7% |
Similar Demographics by College, 1 year or more
Demographics Similar to Hungarians by College, 1 year or more
In terms of college, 1 year or more, the demographic groups most similar to Hungarians are Immigrants from North Macedonia (59.5%, a difference of 0.010%), Immigrants from Southern Europe (59.5%, a difference of 0.010%), Welsh (59.5%, a difference of 0.030%), Immigrants from Albania (59.5%, a difference of 0.030%), and Immigrants from Sierra Leone (59.5%, a difference of 0.040%).
| Demographics | Rating | Rank | College, 1 year or more |
| Somalis | 64.5 /100 | #161 | Good 59.9% |
| Koreans | 58.5 /100 | #162 | Average 59.7% |
| Immigrants | Somalia | 58.3 /100 | #163 | Average 59.7% |
| Belgians | 58.1 /100 | #164 | Average 59.7% |
| Irish | 56.1 /100 | #165 | Average 59.6% |
| Immigrants | Africa | 56.1 /100 | #166 | Average 59.6% |
| Immigrants | North Macedonia | 53.1 /100 | #167 | Average 59.5% |
| Hungarians | 52.9 /100 | #168 | Average 59.5% |
| Immigrants | Southern Europe | 52.7 /100 | #169 | Average 59.5% |
| Welsh | 52.4 /100 | #170 | Average 59.5% |
| Immigrants | Albania | 52.3 /100 | #171 | Average 59.5% |
| Immigrants | Sierra Leone | 52.2 /100 | #172 | Average 59.5% |
| Immigrants | Oceania | 51.2 /100 | #173 | Average 59.4% |
| Celtics | 50.0 /100 | #174 | Average 59.4% |
| Sri Lankans | 49.0 /100 | #175 | Average 59.4% |
Demographics Similar to Alaskan Athabascans by College, 1 year or more
In terms of college, 1 year or more, the demographic groups most similar to Alaskan Athabascans are Alaska Native (53.4%, a difference of 0.020%), Immigrants from Ecuador (53.4%, a difference of 0.020%), Cuban (53.4%, a difference of 0.050%), Chickasaw (53.3%, a difference of 0.18%), and Immigrants from Belize (53.5%, a difference of 0.19%).
| Demographics | Rating | Rank | College, 1 year or more |
| Nicaraguans | 0.1 /100 | #283 | Tragic 53.9% |
| Ute | 0.1 /100 | #284 | Tragic 53.8% |
| Immigrants | Guyana | 0.1 /100 | #285 | Tragic 53.5% |
| Central American Indians | 0.1 /100 | #286 | Tragic 53.5% |
| Immigrants | Belize | 0.1 /100 | #287 | Tragic 53.5% |
| Alaska Natives | 0.0 /100 | #288 | Tragic 53.4% |
| Immigrants | Ecuador | 0.0 /100 | #289 | Tragic 53.4% |
| Alaskan Athabascans | 0.0 /100 | #290 | Tragic 53.4% |
| Cubans | 0.0 /100 | #291 | Tragic 53.4% |
| Chickasaw | 0.0 /100 | #292 | Tragic 53.3% |
| Blacks/African Americans | 0.0 /100 | #293 | Tragic 53.3% |
| Cherokee | 0.0 /100 | #294 | Tragic 53.2% |
| Yaqui | 0.0 /100 | #295 | Tragic 53.2% |
| Sioux | 0.0 /100 | #296 | Tragic 53.0% |
| Paiute | 0.0 /100 | #297 | Tragic 52.9% |