Hungarian vs Immigrants from France College, 1 year or more
COMPARE
Hungarian
Immigrants from France
College, 1 year or more
College, 1 year or more Comparison
Hungarians
Immigrants from France
59.5%
COLLEGE, 1 YEAR OR MORE
52.9/ 100
METRIC RATING
168th/ 347
METRIC RANK
65.8%
COLLEGE, 1 YEAR OR MORE
100.0/ 100
METRIC RATING
28th/ 347
METRIC RANK
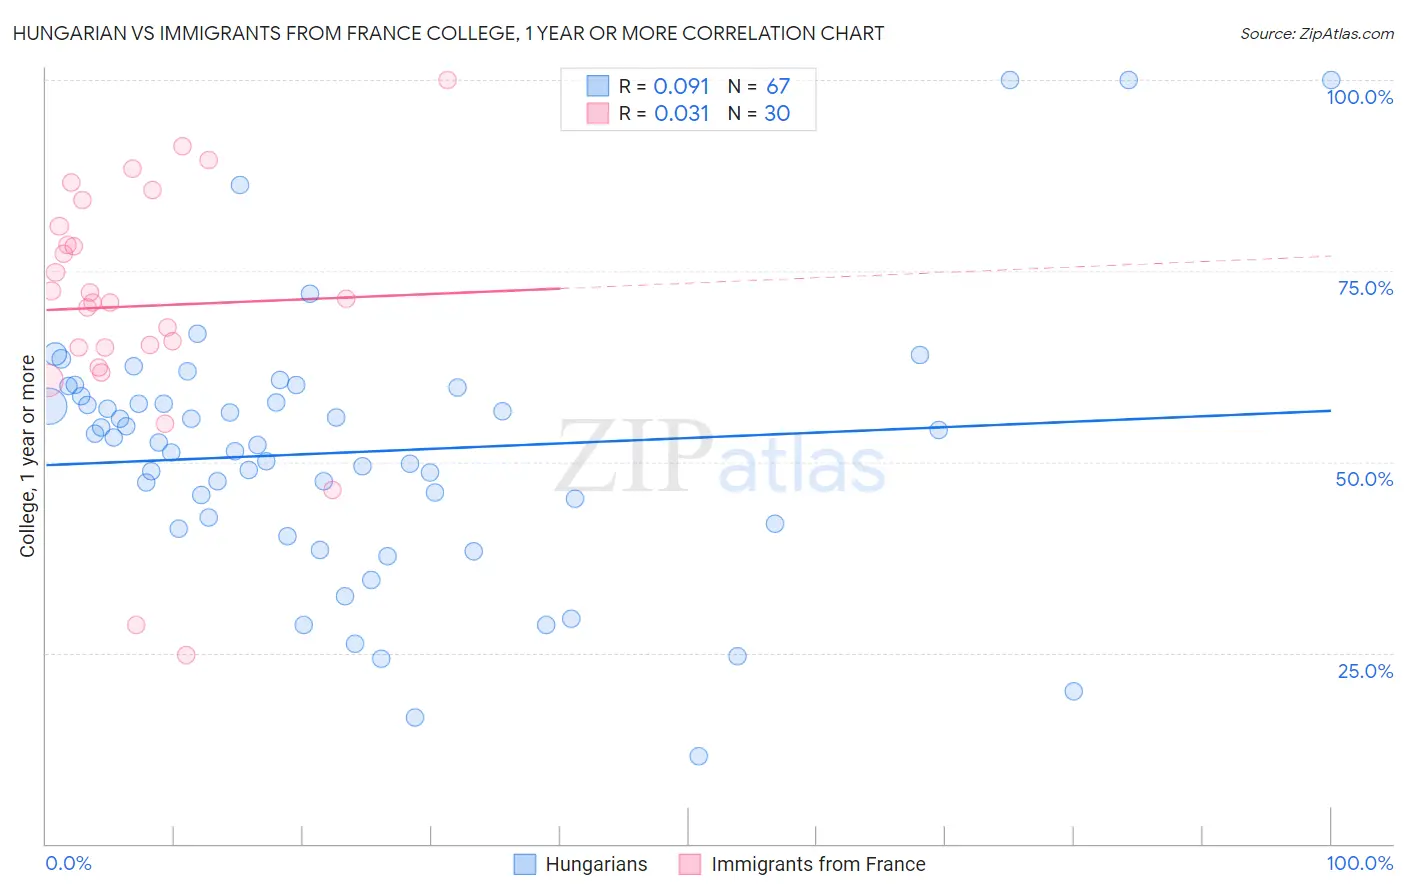
Hungarian vs Immigrants from France College, 1 year or more Correlation Chart
The statistical analysis conducted on geographies consisting of 486,237,030 people shows a slight positive correlation between the proportion of Hungarians and percentage of population with at least college, 1 year or more education in the United States with a correlation coefficient (R) of 0.091 and weighted average of 59.5%. Similarly, the statistical analysis conducted on geographies consisting of 287,918,860 people shows no correlation between the proportion of Immigrants from France and percentage of population with at least college, 1 year or more education in the United States with a correlation coefficient (R) of 0.031 and weighted average of 65.8%, a difference of 10.6%.
College, 1 year or more Correlation Summary
| Measurement | Hungarian | Immigrants from France |
| Minimum | 11.5% | 24.7% |
| Maximum | 100.0% | 100.0% |
| Range | 88.5% | 75.3% |
| Mean | 51.3% | 70.4% |
| Median | 52.6% | 71.2% |
| Interquartile 25% (IQ1) | 41.8% | 64.9% |
| Interquartile 75% (IQ3) | 58.5% | 80.9% |
| Interquartile Range (IQR) | 16.7% | 16.0% |
| Standard Deviation (Sample) | 17.2% | 16.6% |
| Standard Deviation (Population) | 17.1% | 16.3% |
Similar Demographics by College, 1 year or more
Demographics Similar to Hungarians by College, 1 year or more
In terms of college, 1 year or more, the demographic groups most similar to Hungarians are Immigrants from North Macedonia (59.5%, a difference of 0.010%), Immigrants from Southern Europe (59.5%, a difference of 0.010%), Welsh (59.5%, a difference of 0.030%), Immigrants from Albania (59.5%, a difference of 0.030%), and Immigrants from Sierra Leone (59.5%, a difference of 0.040%).
| Demographics | Rating | Rank | College, 1 year or more |
| Somalis | 64.5 /100 | #161 | Good 59.9% |
| Koreans | 58.5 /100 | #162 | Average 59.7% |
| Immigrants | Somalia | 58.3 /100 | #163 | Average 59.7% |
| Belgians | 58.1 /100 | #164 | Average 59.7% |
| Irish | 56.1 /100 | #165 | Average 59.6% |
| Immigrants | Africa | 56.1 /100 | #166 | Average 59.6% |
| Immigrants | North Macedonia | 53.1 /100 | #167 | Average 59.5% |
| Hungarians | 52.9 /100 | #168 | Average 59.5% |
| Immigrants | Southern Europe | 52.7 /100 | #169 | Average 59.5% |
| Welsh | 52.4 /100 | #170 | Average 59.5% |
| Immigrants | Albania | 52.3 /100 | #171 | Average 59.5% |
| Immigrants | Sierra Leone | 52.2 /100 | #172 | Average 59.5% |
| Immigrants | Oceania | 51.2 /100 | #173 | Average 59.4% |
| Celtics | 50.0 /100 | #174 | Average 59.4% |
| Sri Lankans | 49.0 /100 | #175 | Average 59.4% |
Demographics Similar to Immigrants from France by College, 1 year or more
In terms of college, 1 year or more, the demographic groups most similar to Immigrants from France are Immigrants from Ireland (65.9%, a difference of 0.17%), Immigrants from Northern Europe (65.6%, a difference of 0.25%), Immigrants from Denmark (65.6%, a difference of 0.36%), Latvian (66.1%, a difference of 0.37%), and Indian (Asian) (66.1%, a difference of 0.41%).
| Demographics | Rating | Rank | College, 1 year or more |
| Immigrants | Hong Kong | 100.0 /100 | #21 | Exceptional 66.4% |
| Soviet Union | 100.0 /100 | #22 | Exceptional 66.4% |
| Immigrants | China | 100.0 /100 | #23 | Exceptional 66.4% |
| Immigrants | Belgium | 100.0 /100 | #24 | Exceptional 66.3% |
| Indians (Asian) | 100.0 /100 | #25 | Exceptional 66.1% |
| Latvians | 100.0 /100 | #26 | Exceptional 66.1% |
| Immigrants | Ireland | 100.0 /100 | #27 | Exceptional 65.9% |
| Immigrants | France | 100.0 /100 | #28 | Exceptional 65.8% |
| Immigrants | Northern Europe | 100.0 /100 | #29 | Exceptional 65.6% |
| Immigrants | Denmark | 100.0 /100 | #30 | Exceptional 65.6% |
| Turks | 100.0 /100 | #31 | Exceptional 65.5% |
| Bulgarians | 100.0 /100 | #32 | Exceptional 65.5% |
| Immigrants | Sri Lanka | 99.9 /100 | #33 | Exceptional 65.4% |
| Israelis | 99.9 /100 | #34 | Exceptional 65.3% |
| Immigrants | Turkey | 99.9 /100 | #35 | Exceptional 65.2% |