Cheyenne vs Immigrants from Italy College, Under 1 year

COMPARE

Cheyenne
Race
Ancestry
AfghanAfricanAlaska NativeAlaskan AthabascanAlbanianAleutAlsatianAmericanApacheArabArapahoArgentineanArmenianAssyrian/Chaldean/SyriacAustralianAustrianBahamianBangladeshiBarbadianBasqueBelgianBelizeanBermudanBhutaneseBlackfeetBolivianBrazilianBritishBritish West IndianBulgarianBurmeseCajunCambodianCanadianCape VerdeanCarpatho RusynCelticCentral AmericanCentral American IndianCherokeeCheyenneChickasawChileanChineseChippewaChoctawColombianColvilleComancheCosta RicanCreeCreekCroatianCrowCubanCypriotCzechCzechoslovakianDanishDelawareDominicanDutchDutch West IndianEastern EuropeanEcuadorianEgyptianEnglishEstonianEthiopianEuropeanFijianFilipinoFinnishFrenchFrench American IndianFrench CanadianGermanGerman RussianGhanaianGreekGuamanian/ChamorroGuatemalanGuyaneseHaitianHmongHonduranHopiHoumaHungarianIcelanderIndian (Asian)IndonesianInupiatIranianIraqiIrishIroquoisIsraeliItalianJamaicanJapaneseJordanianKenyanKiowaKoreanLaotianLatvianLebaneseLiberianLithuanianLumbeeLuxembourgerMacedonianMalaysianMalteseMarshalleseMenomineeMexicanMexican American IndianMongolianMoroccanNative HawaiianNavajoNepaleseNew ZealanderNicaraguanNigerianNorthern EuropeanNorwegianOkinawanOsageOttawaPaiutePakistaniPalestinianPanamanianParaguayanPennsylvania GermanPeruvianPimaPolishPortuguesePotawatomiPuebloPuerto RicanPuget Sound SalishRomanianRussianSalvadoranSamoanScandinavianScotch-IrishScottishSeminoleSenegaleseSerbianShoshoneSierra LeoneanSiouxSlavicSlovakSloveneSomaliSouth AfricanSouth AmericanSouth American IndianSoviet UnionSpaniardSpanishSpanish AmericanSpanish American IndianSri LankanSubsaharan AfricanSudaneseSwedishSwissSyrianTaiwaneseThaiTlingit-HaidaTohono O'OdhamTonganTrinidadian and TobagonianTsimshianTurkishU.S. Virgin IslanderUgandanUkrainianUruguayanUteVenezuelanVietnameseWelshWest IndianYakamaYaquiYugoslavianYumanYup'ikZimbabwean
Immigration
NonimmigrantsImmigrantsAfghanistanAfricaAlbaniaArgentinaArmeniaAsiaAustraliaAustriaBahamasBangladeshBarbadosBelarusBelgiumBelizeBoliviaBosnia and HerzegovinaBrazilBulgariaBurma/MyanmarCabo VerdeCambodiaCameroonCanadaCaribbeanCentral AmericaChileChinaColombiaCongoCosta RicaCroatiaCubaCzechoslovakiaDenmarkDominicaDominican RepublicEastern AfricaEastern AsiaEastern EuropeEcuadorEgyptEl SalvadorEnglandEritreaEthiopiaEuropeFijiFranceGermanyGhanaGreeceGrenadaGuatemalaGuyanaHaitiHondurasHong KongHungaryIndiaIndonesiaIranIraqIrelandIsraelJamaicaJapanJordanKazakhstanKenyaKoreaKuwaitLaosLatin AmericaLatviaLebanonLiberiaLithuaniaMalaysiaMexicoMicronesiaMiddle AfricaMoldovaMoroccoNepalNetherlandsNicaraguaNigeriaNorth AmericaNorth MacedoniaNorthern AfricaNorthern EuropeNorwayOceaniaPakistanPanamaPeruPhilippinesPolandPortugalRomaniaRussiaSaudi ArabiaScotlandSenegalSerbiaSierra LeoneSingaporeSomaliaSouth AfricaSouth AmericaSouth Central AsiaSouth Eastern AsiaSouthern EuropeSpainSri LankaSt. Vincent and the GrenadinesSudanSwedenSwitzerlandSyriaTaiwanThailandTrinidad and TobagoTurkeyUgandaUkraineUruguayUzbekistanVenezuelaVietnamWest IndiesWestern AfricaWestern AsiaWestern EuropeYemenZaireZimbabweAzores
Immigrants from Italy
Race
Ancestry
AfghanAfricanAlaska NativeAlaskan AthabascanAlbanianAleutAlsatianAmericanApacheArabArapahoArgentineanArmenianAssyrian/Chaldean/SyriacAustralianAustrianBahamianBangladeshiBarbadianBasqueBelgianBelizeanBermudanBhutaneseBlackfeetBolivianBrazilianBritishBritish West IndianBulgarianBurmeseCajunCambodianCanadianCape VerdeanCarpatho RusynCelticCentral AmericanCentral American IndianCherokeeChickasawChileanChineseChippewaChoctawColombianColvilleComancheCosta RicanCreeCreekCroatianCrowCubanCypriotCzechCzechoslovakianDanishDelawareDominicanDutchDutch West IndianEastern EuropeanEcuadorianEgyptianEnglishEstonianEthiopianEuropeanFijianFilipinoFinnishFrenchFrench American IndianFrench CanadianGermanGerman RussianGhanaianGreekGuamanian/ChamorroGuatemalanGuyaneseHaitianHmongHonduranHopiHoumaHungarianIcelanderIndian (Asian)IndonesianInupiatIranianIraqiIrishIroquoisIsraeliItalianJamaicanJapaneseJordanianKenyanKiowaKoreanLaotianLatvianLebaneseLiberianLithuanianLumbeeLuxembourgerMacedonianMalaysianMalteseMarshalleseMenomineeMexicanMexican American IndianMongolianMoroccanNative HawaiianNavajoNepaleseNew ZealanderNicaraguanNigerianNorthern EuropeanNorwegianOkinawanOsageOttawaPaiutePakistaniPalestinianPanamanianParaguayanPennsylvania GermanPeruvianPimaPolishPortuguesePotawatomiPuebloPuerto RicanPuget Sound SalishRomanianRussianSalvadoranSamoanScandinavianScotch-IrishScottishSeminoleSenegaleseSerbianShoshoneSierra LeoneanSiouxSlavicSlovakSloveneSomaliSouth AfricanSouth AmericanSouth American IndianSoviet UnionSpaniardSpanishSpanish AmericanSpanish American IndianSri LankanSubsaharan AfricanSudaneseSwedishSwissSyrianTaiwaneseThaiTlingit-HaidaTohono O'OdhamTonganTrinidadian and TobagonianTsimshianTurkishU.S. Virgin IslanderUgandanUkrainianUruguayanUteVenezuelanVietnameseWelshWest IndianYakamaYaquiYugoslavianYumanYup'ikZimbabwean
Immigration
NonimmigrantsImmigrantsAfghanistanAfricaAlbaniaArgentinaArmeniaAsiaAustraliaAustriaBahamasBangladeshBarbadosBelarusBelgiumBelizeBoliviaBosnia and HerzegovinaBrazilBulgariaBurma/MyanmarCabo VerdeCambodiaCameroonCanadaCaribbeanCentral AmericaChileChinaColombiaCongoCosta RicaCroatiaCubaCzechoslovakiaDenmarkDominicaDominican RepublicEastern AfricaEastern AsiaEastern EuropeEcuadorEgyptEl SalvadorEnglandEritreaEthiopiaEuropeFijiFranceGermanyGhanaGreeceGrenadaGuatemalaGuyanaHaitiHondurasHong KongHungaryIndiaIndonesiaIranIraqIrelandIsraelItalyJamaicaJapanJordanKazakhstanKenyaKoreaKuwaitLaosLatin AmericaLatviaLebanonLiberiaLithuaniaMalaysiaMexicoMicronesiaMiddle AfricaMoldovaMoroccoNepalNetherlandsNicaraguaNigeriaNorth AmericaNorth MacedoniaNorthern AfricaNorthern EuropeNorwayOceaniaPakistanPanamaPeruPhilippinesPolandPortugalRomaniaRussiaSaudi ArabiaScotlandSenegalSerbiaSierra LeoneSingaporeSomaliaSouth AfricaSouth AmericaSouth Central AsiaSouth Eastern AsiaSouthern EuropeSpainSri LankaSt. Vincent and the GrenadinesSudanSwedenSwitzerlandSyriaTaiwanThailandTrinidad and TobagoTurkeyUgandaUkraineUruguayUzbekistanVenezuelaVietnamWest IndiesWestern AfricaWestern AsiaWestern EuropeYemenZaireZimbabweAzores
College, Under 1 year
Income
Poverty
Unemployment
Labor Participation
Family Structure
Vehicle Availability
Education Level
Disability

College, Under 1 year Comparison

Cheyenne

Immigrants from Italy

Tragic
Excellent
60.6%
COLLEGE, UNDER 1 YEAR
0.1/ 100
METRIC RATING
270th/ 347
METRIC RANK
66.8%
COLLEGE, UNDER 1 YEAR
86.9/ 100
METRIC RATING
138th/ 347
METRIC RANK

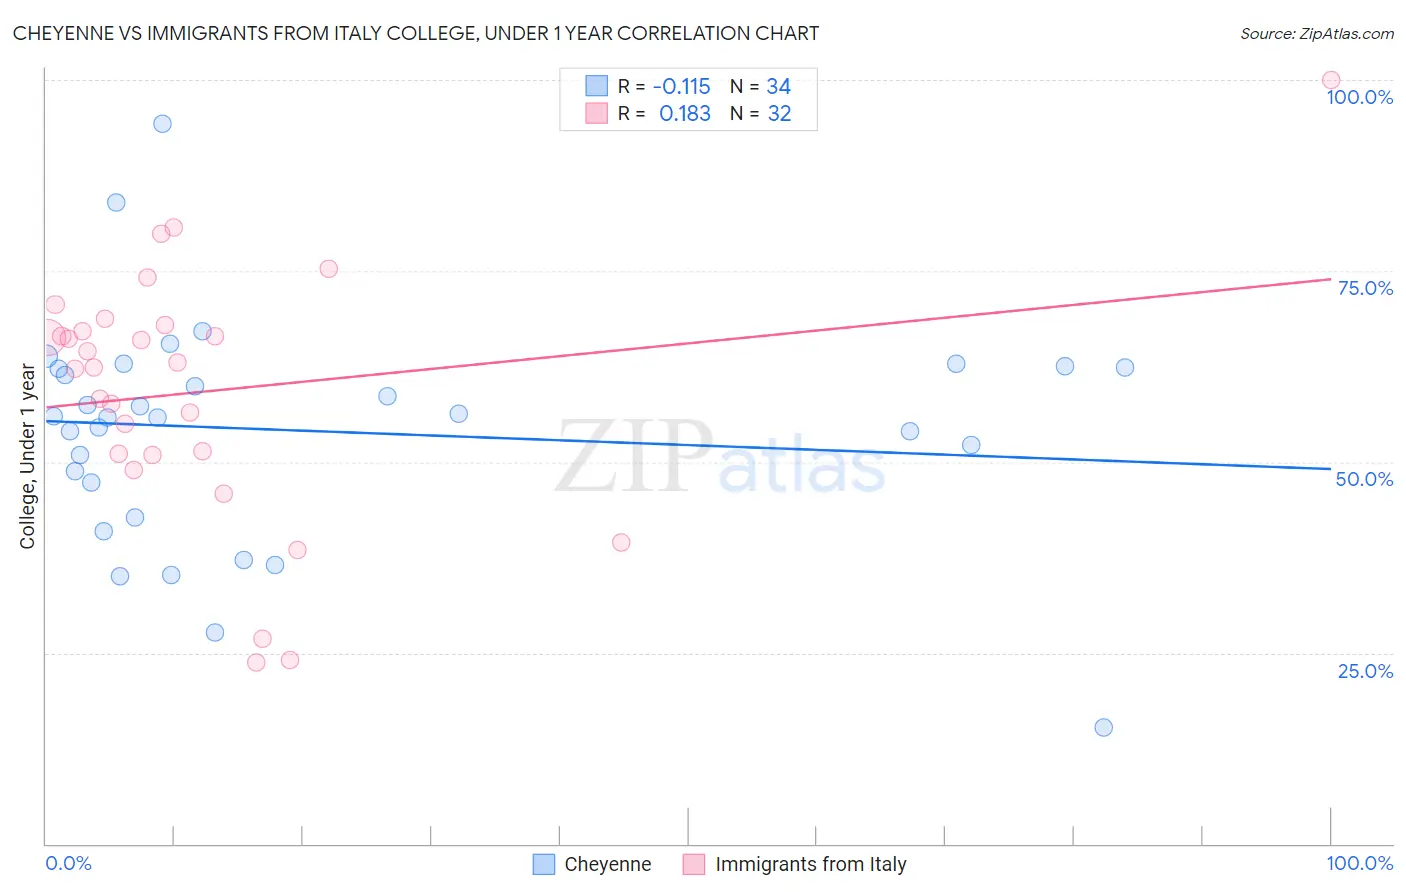
Cheyenne vs Immigrants from Italy College, Under 1 year Correlation Chart

The statistical analysis conducted on geographies consisting of 80,719,411 people shows a poor negative correlation between the proportion of Cheyenne and percentage of population with at least college, under 1 year education in the United States with a correlation coefficient (R) of -0.115 and weighted average of 60.6%. Similarly, the statistical analysis conducted on geographies consisting of 324,223,988 people shows a poor positive correlation between the proportion of Immigrants from Italy and percentage of population with at least college, under 1 year education in the United States with a correlation coefficient (R) of 0.183 and weighted average of 66.8%, a difference of 10.2%.
Cheyenne vs Immigrants from Italy College, Under 1 year

College, Under 1 year Correlation Summary

MeasurementCheyenneImmigrants from Italy
Minimum15.3%23.8%
Maximum94.3%100.0%
Range79.1%76.2%
Mean54.1%59.2%
Median55.9%62.7%
Interquartile 25% (IQ1)47.3%51.0%
Interquartile 75% (IQ3)62.4%67.5%
Interquartile Range (IQR)15.0%16.5%
Standard Deviation (Sample)14.9%16.6%
Standard Deviation (Population)14.7%16.4%

Similar Demographics by College, Under 1 year

Demographics Similar to Cheyenne by College, Under 1 year

In terms of college, under 1 year, the demographic groups most similar to Cheyenne are U.S. Virgin Islander (60.6%, a difference of 0.020%), Immigrants from West Indies (60.6%, a difference of 0.11%), Jamaican (60.5%, a difference of 0.17%), Chickasaw (60.4%, a difference of 0.22%), and Alaska Native (60.4%, a difference of 0.22%).
DemographicsRating | RankCollege, Under 1 year
Shoshone
0.2
/100
|
#263
Tragic
61.1%
Trinidadians and Tobagonians
0.2
/100
|
#264
Tragic
61.1%
Immigrants | Bahamas
0.2
/100
|
#265
Tragic
61.1%
Alaskan Athabascans
0.2
/100
|
#266
Tragic
61.0%
Americans
0.2
/100
|
#267
Tragic
61.0%
Immigrants | Trinidad and Tobago
0.1
/100
|
#268
Tragic
60.7%
Immigrants | West Indies
0.1
/100
|
#269
Tragic
60.6%
Cheyenne
0.1
/100
|
#270
Tragic
60.6%
U.S. Virgin Islanders
0.1
/100
|
#271
Tragic
60.6%
Jamaicans
0.1
/100
|
#272
Tragic
60.5%
Chickasaw
0.1
/100
|
#273
Tragic
60.4%
Alaska Natives
0.1
/100
|
#274
Tragic
60.4%
Immigrants | Barbados
0.1
/100
|
#275
Tragic
60.4%
Arapaho
0.1
/100
|
#276
Tragic
60.3%
Bahamians
0.1
/100
|
#277
Tragic
60.3%

Demographics Similar to Immigrants from Italy by College, Under 1 year

In terms of college, under 1 year, the demographic groups most similar to Immigrants from Italy are Immigrants from Chile (66.8%, a difference of 0.050%), Ugandan (66.8%, a difference of 0.080%), Canadian (66.8%, a difference of 0.090%), Iraqi (66.8%, a difference of 0.10%), and Venezuelan (66.7%, a difference of 0.10%).
DemographicsRating | RankCollege, Under 1 year
Finns
88.6
/100
|
#131
Excellent
66.9%
Poles
88.4
/100
|
#132
Excellent
66.9%
Immigrants | Brazil
88.3
/100
|
#133
Excellent
66.9%
Iraqis
88.0
/100
|
#134
Excellent
66.8%
Canadians
87.9
/100
|
#135
Excellent
66.8%
Ugandans
87.8
/100
|
#136
Excellent
66.8%
Immigrants | Chile
87.4
/100
|
#137
Excellent
66.8%
Immigrants | Italy
86.9
/100
|
#138
Excellent
66.8%
Venezuelans
85.9
/100
|
#139
Excellent
66.7%
Slavs
85.9
/100
|
#140
Excellent
66.7%
Immigrants | Afghanistan
85.1
/100
|
#141
Excellent
66.7%
English
82.9
/100
|
#142
Excellent
66.6%
Immigrants | Uganda
82.8
/100
|
#143
Excellent
66.5%
Immigrants | Germany
82.0
/100
|
#144
Excellent
66.5%
Immigrants | Kenya
81.8
/100
|
#145
Excellent
66.5%