Scotch-Irish vs Ecuadorian Disability Age 65 to 74
COMPARE
Scotch-Irish
Ecuadorian
Disability Age 65 to 74
Disability Age 65 to 74 Comparison
Scotch-Irish
Ecuadorians
24.4%
DISABILITY AGE 65 TO 74
3.8/ 100
METRIC RATING
235th/ 347
METRIC RANK
23.6%
DISABILITY AGE 65 TO 74
29.7/ 100
METRIC RATING
192nd/ 347
METRIC RANK
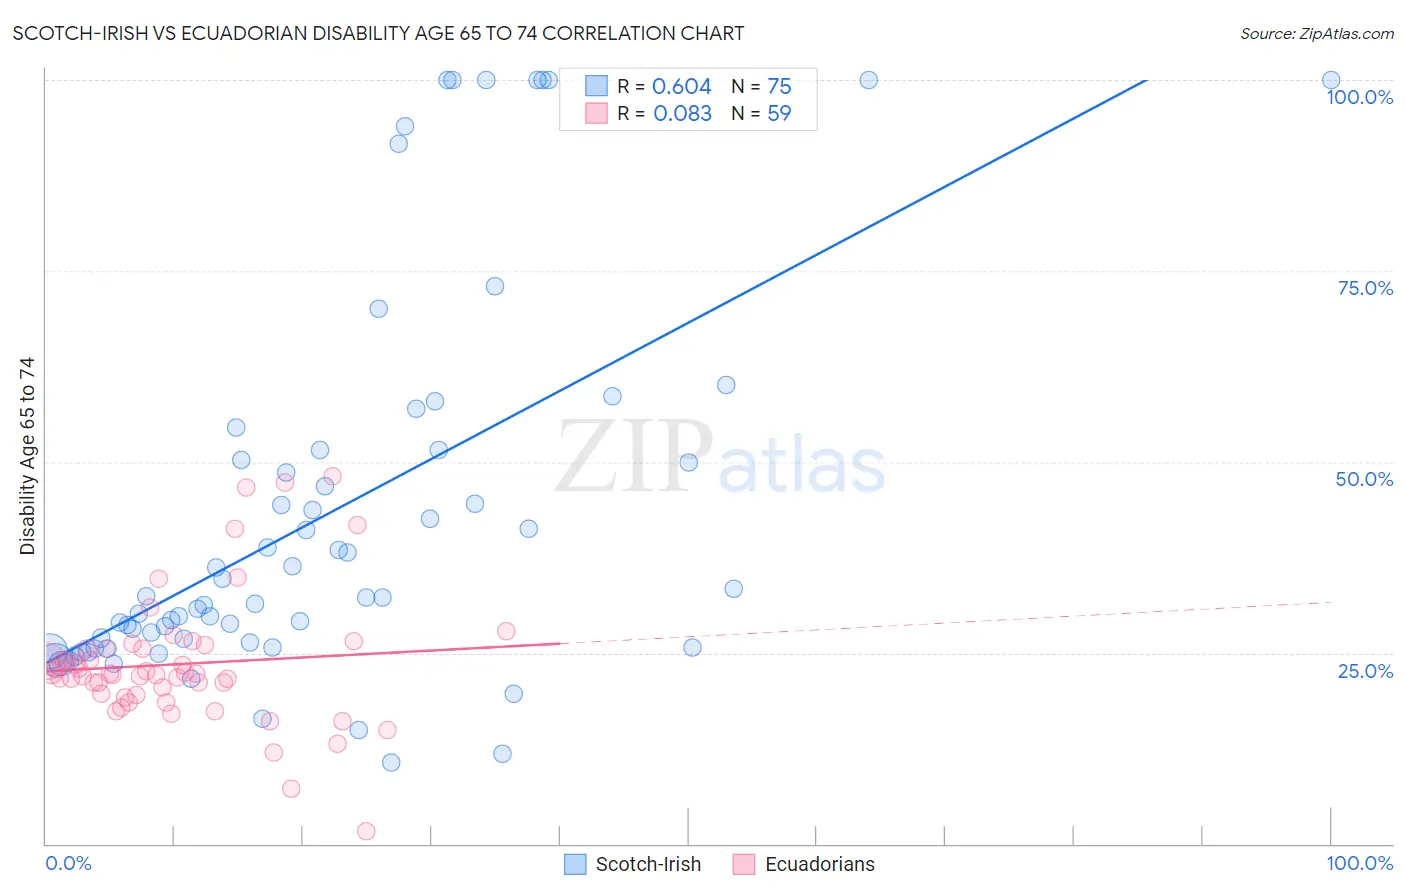
Scotch-Irish vs Ecuadorian Disability Age 65 to 74 Correlation Chart
The statistical analysis conducted on geographies consisting of 546,992,221 people shows a significant positive correlation between the proportion of Scotch-Irish and percentage of population with a disability between the ages 65 and 75 in the United States with a correlation coefficient (R) of 0.604 and weighted average of 24.4%. Similarly, the statistical analysis conducted on geographies consisting of 317,118,668 people shows a slight positive correlation between the proportion of Ecuadorians and percentage of population with a disability between the ages 65 and 75 in the United States with a correlation coefficient (R) of 0.083 and weighted average of 23.6%, a difference of 3.4%.
Disability Age 65 to 74 Correlation Summary
| Measurement | Scotch-Irish | Ecuadorian |
| Minimum | 10.7% | 1.6% |
| Maximum | 100.0% | 48.2% |
| Range | 89.3% | 46.6% |
| Mean | 43.1% | 23.5% |
| Median | 32.3% | 22.2% |
| Interquartile 25% (IQ1) | 25.8% | 19.5% |
| Interquartile 75% (IQ3) | 51.5% | 25.6% |
| Interquartile Range (IQR) | 25.7% | 6.1% |
| Standard Deviation (Sample) | 25.2% | 8.5% |
| Standard Deviation (Population) | 25.0% | 8.5% |
Similar Demographics by Disability Age 65 to 74
Demographics Similar to Scotch-Irish by Disability Age 65 to 74
In terms of disability age 65 to 74, the demographic groups most similar to Scotch-Irish are German Russian (24.4%, a difference of 0.040%), West Indian (24.5%, a difference of 0.14%), Panamanian (24.4%, a difference of 0.16%), Bahamian (24.4%, a difference of 0.26%), and Immigrants from Ghana (24.5%, a difference of 0.31%).
| Demographics | Rating | Rank | Disability Age 65 to 74 |
| Whites/Caucasians | 6.6 /100 | #228 | Tragic 24.2% |
| Celtics | 6.4 /100 | #229 | Tragic 24.2% |
| Barbadians | 6.0 /100 | #230 | Tragic 24.3% |
| Immigrants | Thailand | 5.2 /100 | #231 | Tragic 24.3% |
| Immigrants | Zaire | 5.0 /100 | #232 | Tragic 24.3% |
| Bahamians | 4.5 /100 | #233 | Tragic 24.4% |
| Panamanians | 4.2 /100 | #234 | Tragic 24.4% |
| Scotch-Irish | 3.8 /100 | #235 | Tragic 24.4% |
| German Russians | 3.7 /100 | #236 | Tragic 24.4% |
| West Indians | 3.4 /100 | #237 | Tragic 24.5% |
| Immigrants | Ghana | 3.0 /100 | #238 | Tragic 24.5% |
| Immigrants | Caribbean | 2.6 /100 | #239 | Tragic 24.6% |
| Spaniards | 2.4 /100 | #240 | Tragic 24.6% |
| Immigrants | Western Africa | 2.3 /100 | #241 | Tragic 24.6% |
| Immigrants | Senegal | 2.2 /100 | #242 | Tragic 24.6% |
Demographics Similar to Ecuadorians by Disability Age 65 to 74
In terms of disability age 65 to 74, the demographic groups most similar to Ecuadorians are Immigrants from Bangladesh (23.6%, a difference of 0.030%), English (23.6%, a difference of 0.080%), Immigrants from Guyana (23.6%, a difference of 0.10%), Sudanese (23.7%, a difference of 0.13%), and Scottish (23.6%, a difference of 0.23%).
| Demographics | Rating | Rank | Disability Age 65 to 74 |
| Haitians | 42.4 /100 | #185 | Average 23.4% |
| Basques | 38.4 /100 | #186 | Fair 23.5% |
| Portuguese | 37.8 /100 | #187 | Fair 23.5% |
| Immigrants | Cuba | 34.0 /100 | #188 | Fair 23.6% |
| Scottish | 33.1 /100 | #189 | Fair 23.6% |
| Immigrants | Guyana | 31.2 /100 | #190 | Fair 23.6% |
| Immigrants | Bangladesh | 30.2 /100 | #191 | Fair 23.6% |
| Ecuadorians | 29.7 /100 | #192 | Fair 23.6% |
| English | 28.5 /100 | #193 | Fair 23.6% |
| Sudanese | 27.8 /100 | #194 | Fair 23.7% |
| Immigrants | St. Vincent and the Grenadines | 26.1 /100 | #195 | Fair 23.7% |
| Immigrants | Trinidad and Tobago | 26.1 /100 | #196 | Fair 23.7% |
| Immigrants | Immigrants | 25.8 /100 | #197 | Fair 23.7% |
| Immigrants | Africa | 24.4 /100 | #198 | Fair 23.7% |
| Welsh | 24.3 /100 | #199 | Fair 23.7% |