Scotch-Irish vs Filipino Disability Age 65 to 74
COMPARE
Scotch-Irish
Filipino
Disability Age 65 to 74
Disability Age 65 to 74 Comparison
Scotch-Irish
Filipinos
24.4%
DISABILITY AGE 65 TO 74
3.8/ 100
METRIC RATING
235th/ 347
METRIC RANK
19.0%
DISABILITY AGE 65 TO 74
100.0/ 100
METRIC RATING
2nd/ 347
METRIC RANK
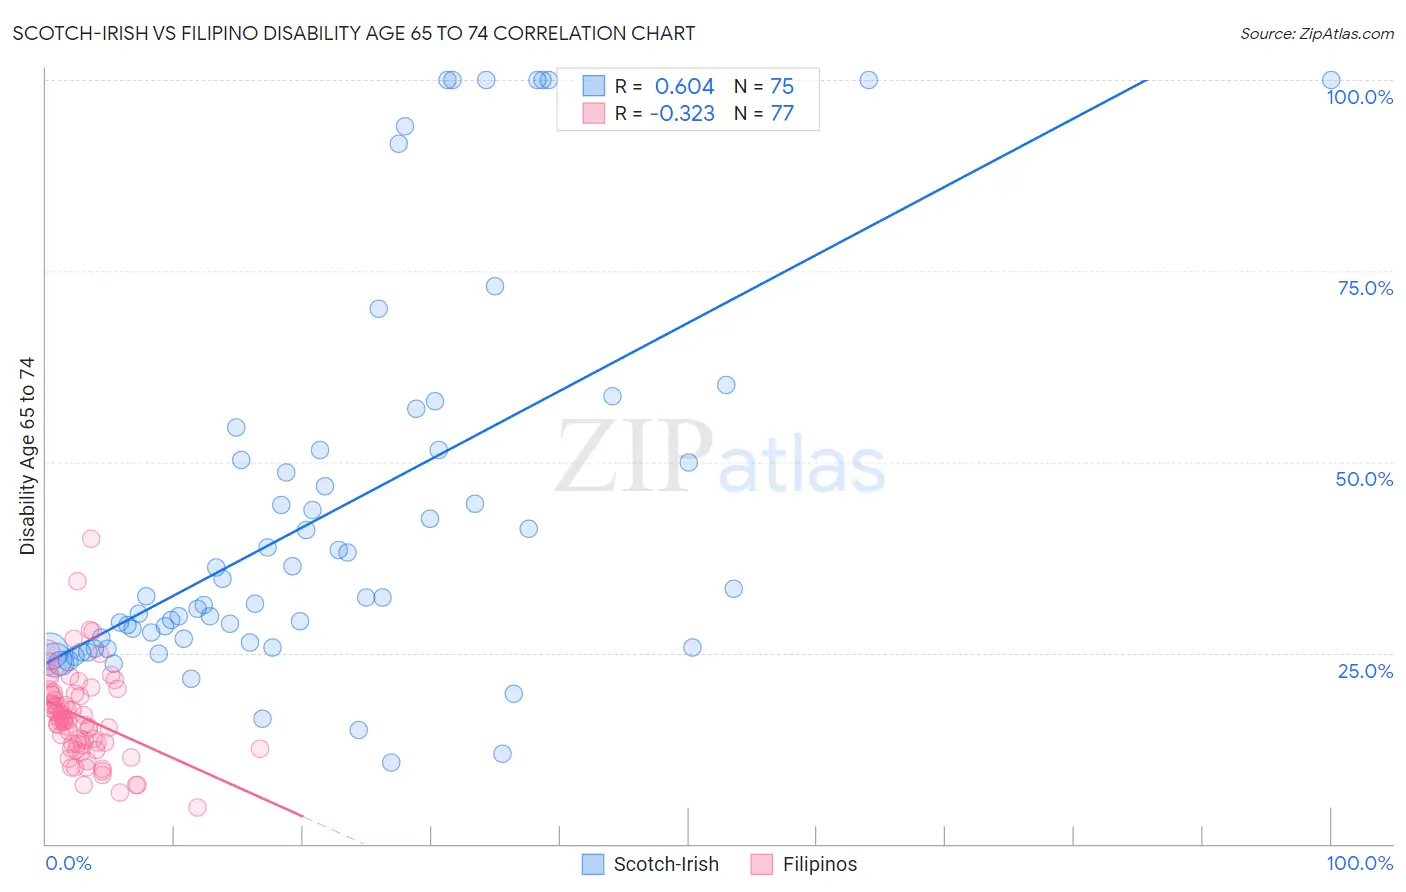
Scotch-Irish vs Filipino Disability Age 65 to 74 Correlation Chart
The statistical analysis conducted on geographies consisting of 546,992,221 people shows a significant positive correlation between the proportion of Scotch-Irish and percentage of population with a disability between the ages 65 and 75 in the United States with a correlation coefficient (R) of 0.604 and weighted average of 24.4%. Similarly, the statistical analysis conducted on geographies consisting of 253,881,065 people shows a mild negative correlation between the proportion of Filipinos and percentage of population with a disability between the ages 65 and 75 in the United States with a correlation coefficient (R) of -0.323 and weighted average of 19.0%, a difference of 28.6%.
Disability Age 65 to 74 Correlation Summary
| Measurement | Scotch-Irish | Filipino |
| Minimum | 10.7% | 4.7% |
| Maximum | 100.0% | 40.0% |
| Range | 89.3% | 35.3% |
| Mean | 43.1% | 16.6% |
| Median | 32.3% | 16.1% |
| Interquartile 25% (IQ1) | 25.8% | 12.7% |
| Interquartile 75% (IQ3) | 51.5% | 19.6% |
| Interquartile Range (IQR) | 25.7% | 6.9% |
| Standard Deviation (Sample) | 25.2% | 6.0% |
| Standard Deviation (Population) | 25.0% | 6.0% |
Similar Demographics by Disability Age 65 to 74
Demographics Similar to Scotch-Irish by Disability Age 65 to 74
In terms of disability age 65 to 74, the demographic groups most similar to Scotch-Irish are German Russian (24.4%, a difference of 0.040%), West Indian (24.5%, a difference of 0.14%), Panamanian (24.4%, a difference of 0.16%), Bahamian (24.4%, a difference of 0.26%), and Immigrants from Ghana (24.5%, a difference of 0.31%).
| Demographics | Rating | Rank | Disability Age 65 to 74 |
| Whites/Caucasians | 6.6 /100 | #228 | Tragic 24.2% |
| Celtics | 6.4 /100 | #229 | Tragic 24.2% |
| Barbadians | 6.0 /100 | #230 | Tragic 24.3% |
| Immigrants | Thailand | 5.2 /100 | #231 | Tragic 24.3% |
| Immigrants | Zaire | 5.0 /100 | #232 | Tragic 24.3% |
| Bahamians | 4.5 /100 | #233 | Tragic 24.4% |
| Panamanians | 4.2 /100 | #234 | Tragic 24.4% |
| Scotch-Irish | 3.8 /100 | #235 | Tragic 24.4% |
| German Russians | 3.7 /100 | #236 | Tragic 24.4% |
| West Indians | 3.4 /100 | #237 | Tragic 24.5% |
| Immigrants | Ghana | 3.0 /100 | #238 | Tragic 24.5% |
| Immigrants | Caribbean | 2.6 /100 | #239 | Tragic 24.6% |
| Spaniards | 2.4 /100 | #240 | Tragic 24.6% |
| Immigrants | Western Africa | 2.3 /100 | #241 | Tragic 24.6% |
| Immigrants | Senegal | 2.2 /100 | #242 | Tragic 24.6% |
Demographics Similar to Filipinos by Disability Age 65 to 74
In terms of disability age 65 to 74, the demographic groups most similar to Filipinos are Immigrants from Taiwan (18.8%, a difference of 1.2%), Immigrants from India (19.7%, a difference of 3.6%), Immigrants from Hong Kong (19.9%, a difference of 4.5%), Immigrants from Israel (19.9%, a difference of 4.8%), and Iranian (19.9%, a difference of 4.9%).
| Demographics | Rating | Rank | Disability Age 65 to 74 |
| Immigrants | Taiwan | 100.0 /100 | #1 | Exceptional 18.8% |
| Filipinos | 100.0 /100 | #2 | Exceptional 19.0% |
| Immigrants | India | 100.0 /100 | #3 | Exceptional 19.7% |
| Immigrants | Hong Kong | 100.0 /100 | #4 | Exceptional 19.9% |
| Immigrants | Israel | 100.0 /100 | #5 | Exceptional 19.9% |
| Iranians | 100.0 /100 | #6 | Exceptional 19.9% |
| Cypriots | 100.0 /100 | #7 | Exceptional 20.1% |
| Thais | 100.0 /100 | #8 | Exceptional 20.1% |
| Immigrants | China | 100.0 /100 | #9 | Exceptional 20.3% |
| Immigrants | Eastern Asia | 100.0 /100 | #10 | Exceptional 20.3% |
| Immigrants | Ireland | 100.0 /100 | #11 | Exceptional 20.3% |
| Immigrants | Korea | 100.0 /100 | #12 | Exceptional 20.4% |
| Immigrants | Singapore | 100.0 /100 | #13 | Exceptional 20.4% |
| Indians (Asian) | 100.0 /100 | #14 | Exceptional 20.5% |
| Paraguayans | 100.0 /100 | #15 | Exceptional 20.5% |