Scotch-Irish vs Bhutanese Disability Age 65 to 74
COMPARE
Scotch-Irish
Bhutanese
Disability Age 65 to 74
Disability Age 65 to 74 Comparison
Scotch-Irish
Bhutanese
24.4%
DISABILITY AGE 65 TO 74
3.8/ 100
METRIC RATING
235th/ 347
METRIC RANK
21.5%
DISABILITY AGE 65 TO 74
99.6/ 100
METRIC RATING
53rd/ 347
METRIC RANK
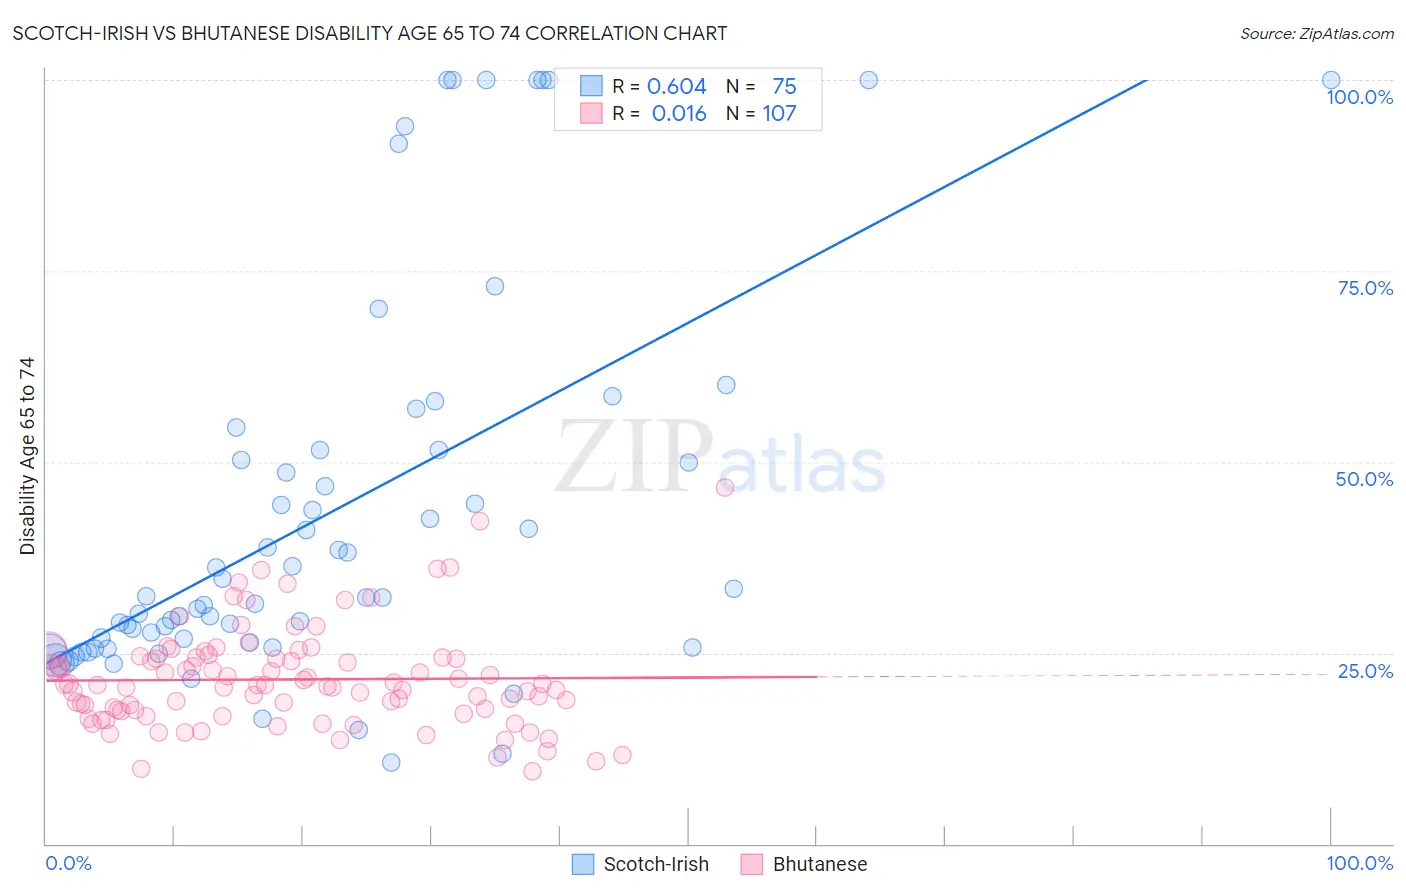
Scotch-Irish vs Bhutanese Disability Age 65 to 74 Correlation Chart
The statistical analysis conducted on geographies consisting of 546,992,221 people shows a significant positive correlation between the proportion of Scotch-Irish and percentage of population with a disability between the ages 65 and 75 in the United States with a correlation coefficient (R) of 0.604 and weighted average of 24.4%. Similarly, the statistical analysis conducted on geographies consisting of 454,236,804 people shows no correlation between the proportion of Bhutanese and percentage of population with a disability between the ages 65 and 75 in the United States with a correlation coefficient (R) of 0.016 and weighted average of 21.5%, a difference of 13.7%.
Disability Age 65 to 74 Correlation Summary
| Measurement | Scotch-Irish | Bhutanese |
| Minimum | 10.7% | 9.6% |
| Maximum | 100.0% | 46.7% |
| Range | 89.3% | 37.1% |
| Mean | 43.1% | 21.5% |
| Median | 32.3% | 20.8% |
| Interquartile 25% (IQ1) | 25.8% | 17.3% |
| Interquartile 75% (IQ3) | 51.5% | 24.3% |
| Interquartile Range (IQR) | 25.7% | 7.0% |
| Standard Deviation (Sample) | 25.2% | 6.6% |
| Standard Deviation (Population) | 25.0% | 6.6% |
Similar Demographics by Disability Age 65 to 74
Demographics Similar to Scotch-Irish by Disability Age 65 to 74
In terms of disability age 65 to 74, the demographic groups most similar to Scotch-Irish are German Russian (24.4%, a difference of 0.040%), West Indian (24.5%, a difference of 0.14%), Panamanian (24.4%, a difference of 0.16%), Bahamian (24.4%, a difference of 0.26%), and Immigrants from Ghana (24.5%, a difference of 0.31%).
| Demographics | Rating | Rank | Disability Age 65 to 74 |
| Whites/Caucasians | 6.6 /100 | #228 | Tragic 24.2% |
| Celtics | 6.4 /100 | #229 | Tragic 24.2% |
| Barbadians | 6.0 /100 | #230 | Tragic 24.3% |
| Immigrants | Thailand | 5.2 /100 | #231 | Tragic 24.3% |
| Immigrants | Zaire | 5.0 /100 | #232 | Tragic 24.3% |
| Bahamians | 4.5 /100 | #233 | Tragic 24.4% |
| Panamanians | 4.2 /100 | #234 | Tragic 24.4% |
| Scotch-Irish | 3.8 /100 | #235 | Tragic 24.4% |
| German Russians | 3.7 /100 | #236 | Tragic 24.4% |
| West Indians | 3.4 /100 | #237 | Tragic 24.5% |
| Immigrants | Ghana | 3.0 /100 | #238 | Tragic 24.5% |
| Immigrants | Caribbean | 2.6 /100 | #239 | Tragic 24.6% |
| Spaniards | 2.4 /100 | #240 | Tragic 24.6% |
| Immigrants | Western Africa | 2.3 /100 | #241 | Tragic 24.6% |
| Immigrants | Senegal | 2.2 /100 | #242 | Tragic 24.6% |
Demographics Similar to Bhutanese by Disability Age 65 to 74
In terms of disability age 65 to 74, the demographic groups most similar to Bhutanese are Immigrants from France (21.5%, a difference of 0.010%), Immigrants from Italy (21.5%, a difference of 0.010%), Immigrants from Romania (21.5%, a difference of 0.090%), Immigrants from Denmark (21.5%, a difference of 0.11%), and Immigrants from Asia (21.5%, a difference of 0.20%).
| Demographics | Rating | Rank | Disability Age 65 to 74 |
| Immigrants | Turkey | 99.7 /100 | #46 | Exceptional 21.4% |
| Immigrants | Bulgaria | 99.7 /100 | #47 | Exceptional 21.4% |
| Lithuanians | 99.7 /100 | #48 | Exceptional 21.4% |
| Luxembourgers | 99.7 /100 | #49 | Exceptional 21.4% |
| Immigrants | Malaysia | 99.7 /100 | #50 | Exceptional 21.4% |
| Immigrants | Serbia | 99.6 /100 | #51 | Exceptional 21.4% |
| Immigrants | France | 99.6 /100 | #52 | Exceptional 21.5% |
| Bhutanese | 99.6 /100 | #53 | Exceptional 21.5% |
| Immigrants | Italy | 99.6 /100 | #54 | Exceptional 21.5% |
| Immigrants | Romania | 99.5 /100 | #55 | Exceptional 21.5% |
| Immigrants | Denmark | 99.5 /100 | #56 | Exceptional 21.5% |
| Immigrants | Asia | 99.5 /100 | #57 | Exceptional 21.5% |
| Immigrants | Pakistan | 99.5 /100 | #58 | Exceptional 21.5% |
| Zimbabweans | 99.5 /100 | #59 | Exceptional 21.5% |
| Immigrants | North Macedonia | 99.5 /100 | #60 | Exceptional 21.6% |