Scotch-Irish vs Hungarian Disability Age 65 to 74
COMPARE
Scotch-Irish
Hungarian
Disability Age 65 to 74
Disability Age 65 to 74 Comparison
Scotch-Irish
Hungarians
24.4%
DISABILITY AGE 65 TO 74
3.8/ 100
METRIC RATING
235th/ 347
METRIC RANK
22.4%
DISABILITY AGE 65 TO 74
93.3/ 100
METRIC RATING
123rd/ 347
METRIC RANK
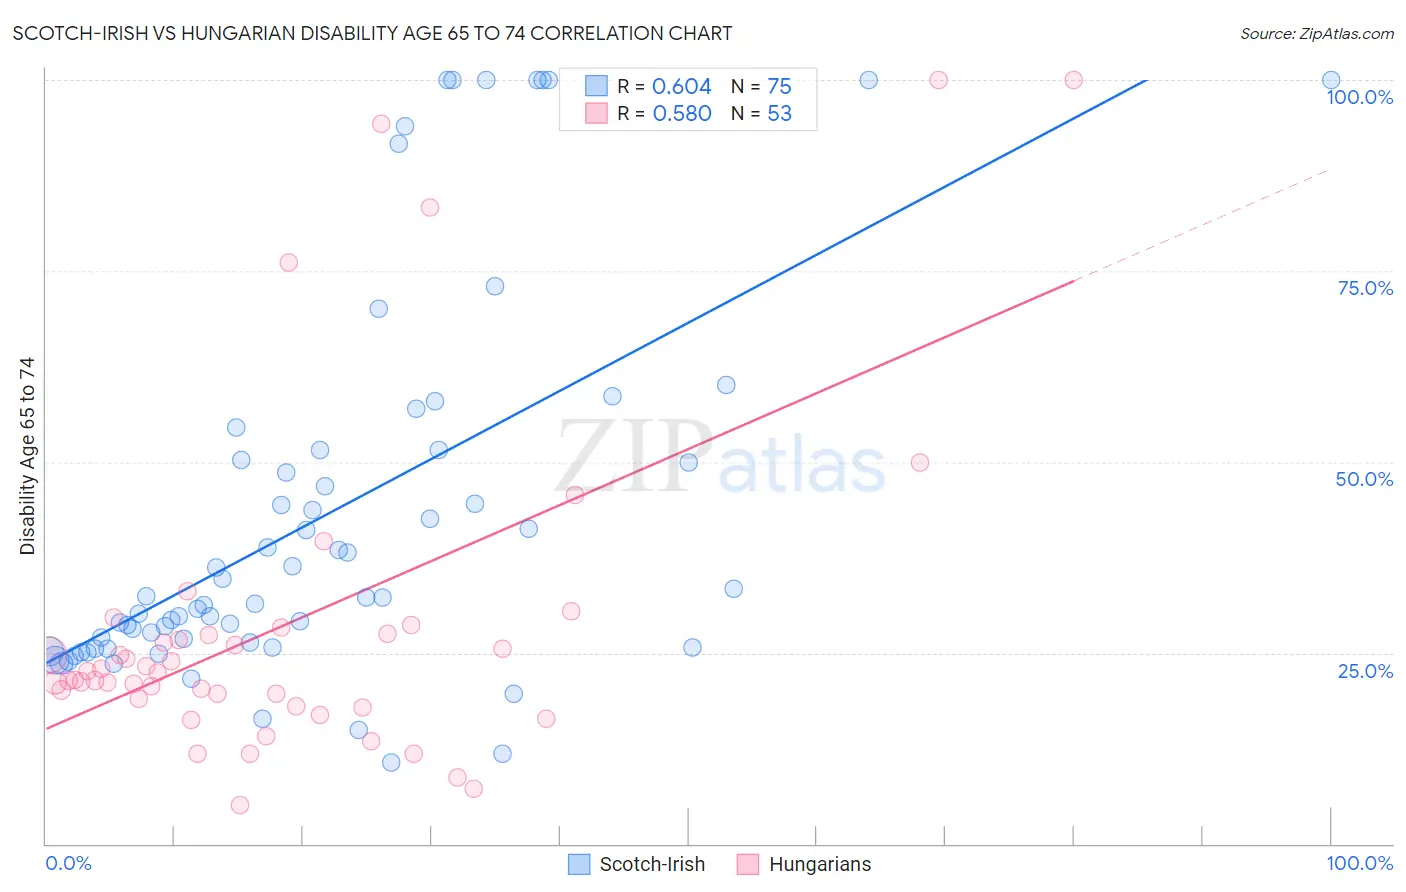
Scotch-Irish vs Hungarian Disability Age 65 to 74 Correlation Chart
The statistical analysis conducted on geographies consisting of 546,992,221 people shows a significant positive correlation between the proportion of Scotch-Irish and percentage of population with a disability between the ages 65 and 75 in the United States with a correlation coefficient (R) of 0.604 and weighted average of 24.4%. Similarly, the statistical analysis conducted on geographies consisting of 484,991,296 people shows a substantial positive correlation between the proportion of Hungarians and percentage of population with a disability between the ages 65 and 75 in the United States with a correlation coefficient (R) of 0.580 and weighted average of 22.4%, a difference of 8.9%.
Disability Age 65 to 74 Correlation Summary
| Measurement | Scotch-Irish | Hungarian |
| Minimum | 10.7% | 5.1% |
| Maximum | 100.0% | 100.0% |
| Range | 89.3% | 94.9% |
| Mean | 43.1% | 28.7% |
| Median | 32.3% | 22.4% |
| Interquartile 25% (IQ1) | 25.8% | 18.5% |
| Interquartile 75% (IQ3) | 51.5% | 27.9% |
| Interquartile Range (IQR) | 25.7% | 9.3% |
| Standard Deviation (Sample) | 25.2% | 22.0% |
| Standard Deviation (Population) | 25.0% | 21.8% |
Similar Demographics by Disability Age 65 to 74
Demographics Similar to Scotch-Irish by Disability Age 65 to 74
In terms of disability age 65 to 74, the demographic groups most similar to Scotch-Irish are German Russian (24.4%, a difference of 0.040%), West Indian (24.5%, a difference of 0.14%), Panamanian (24.4%, a difference of 0.16%), Bahamian (24.4%, a difference of 0.26%), and Immigrants from Ghana (24.5%, a difference of 0.31%).
| Demographics | Rating | Rank | Disability Age 65 to 74 |
| Whites/Caucasians | 6.6 /100 | #228 | Tragic 24.2% |
| Celtics | 6.4 /100 | #229 | Tragic 24.2% |
| Barbadians | 6.0 /100 | #230 | Tragic 24.3% |
| Immigrants | Thailand | 5.2 /100 | #231 | Tragic 24.3% |
| Immigrants | Zaire | 5.0 /100 | #232 | Tragic 24.3% |
| Bahamians | 4.5 /100 | #233 | Tragic 24.4% |
| Panamanians | 4.2 /100 | #234 | Tragic 24.4% |
| Scotch-Irish | 3.8 /100 | #235 | Tragic 24.4% |
| German Russians | 3.7 /100 | #236 | Tragic 24.4% |
| West Indians | 3.4 /100 | #237 | Tragic 24.5% |
| Immigrants | Ghana | 3.0 /100 | #238 | Tragic 24.5% |
| Immigrants | Caribbean | 2.6 /100 | #239 | Tragic 24.6% |
| Spaniards | 2.4 /100 | #240 | Tragic 24.6% |
| Immigrants | Western Africa | 2.3 /100 | #241 | Tragic 24.6% |
| Immigrants | Senegal | 2.2 /100 | #242 | Tragic 24.6% |
Demographics Similar to Hungarians by Disability Age 65 to 74
In terms of disability age 65 to 74, the demographic groups most similar to Hungarians are Czech (22.4%, a difference of 0.050%), Immigrants from Jordan (22.4%, a difference of 0.050%), Immigrants from Kazakhstan (22.4%, a difference of 0.15%), Norwegian (22.5%, a difference of 0.19%), and Immigrants from Western Europe (22.5%, a difference of 0.23%).
| Demographics | Rating | Rank | Disability Age 65 to 74 |
| Brazilians | 94.8 /100 | #116 | Exceptional 22.4% |
| Swedes | 94.7 /100 | #117 | Exceptional 22.4% |
| Austrians | 94.7 /100 | #118 | Exceptional 22.4% |
| Immigrants | Northern Africa | 94.7 /100 | #119 | Exceptional 22.4% |
| Immigrants | Kazakhstan | 93.9 /100 | #120 | Exceptional 22.4% |
| Czechs | 93.5 /100 | #121 | Exceptional 22.4% |
| Immigrants | Jordan | 93.5 /100 | #122 | Exceptional 22.4% |
| Hungarians | 93.3 /100 | #123 | Exceptional 22.4% |
| Norwegians | 92.5 /100 | #124 | Exceptional 22.5% |
| Immigrants | Western Europe | 92.3 /100 | #125 | Exceptional 22.5% |
| Lebanese | 92.2 /100 | #126 | Exceptional 22.5% |
| Slovaks | 91.6 /100 | #127 | Exceptional 22.5% |
| Immigrants | Costa Rica | 90.4 /100 | #128 | Exceptional 22.6% |
| Immigrants | Uruguay | 90.1 /100 | #129 | Exceptional 22.6% |
| Immigrants | Albania | 90.0 /100 | #130 | Excellent 22.6% |