Scotch-Irish vs Argentinean Disability Age 65 to 74
COMPARE
Scotch-Irish
Argentinean
Disability Age 65 to 74
Disability Age 65 to 74 Comparison
Scotch-Irish
Argentineans
24.4%
DISABILITY AGE 65 TO 74
3.8/ 100
METRIC RATING
235th/ 347
METRIC RANK
21.2%
DISABILITY AGE 65 TO 74
99.8/ 100
METRIC RATING
39th/ 347
METRIC RANK
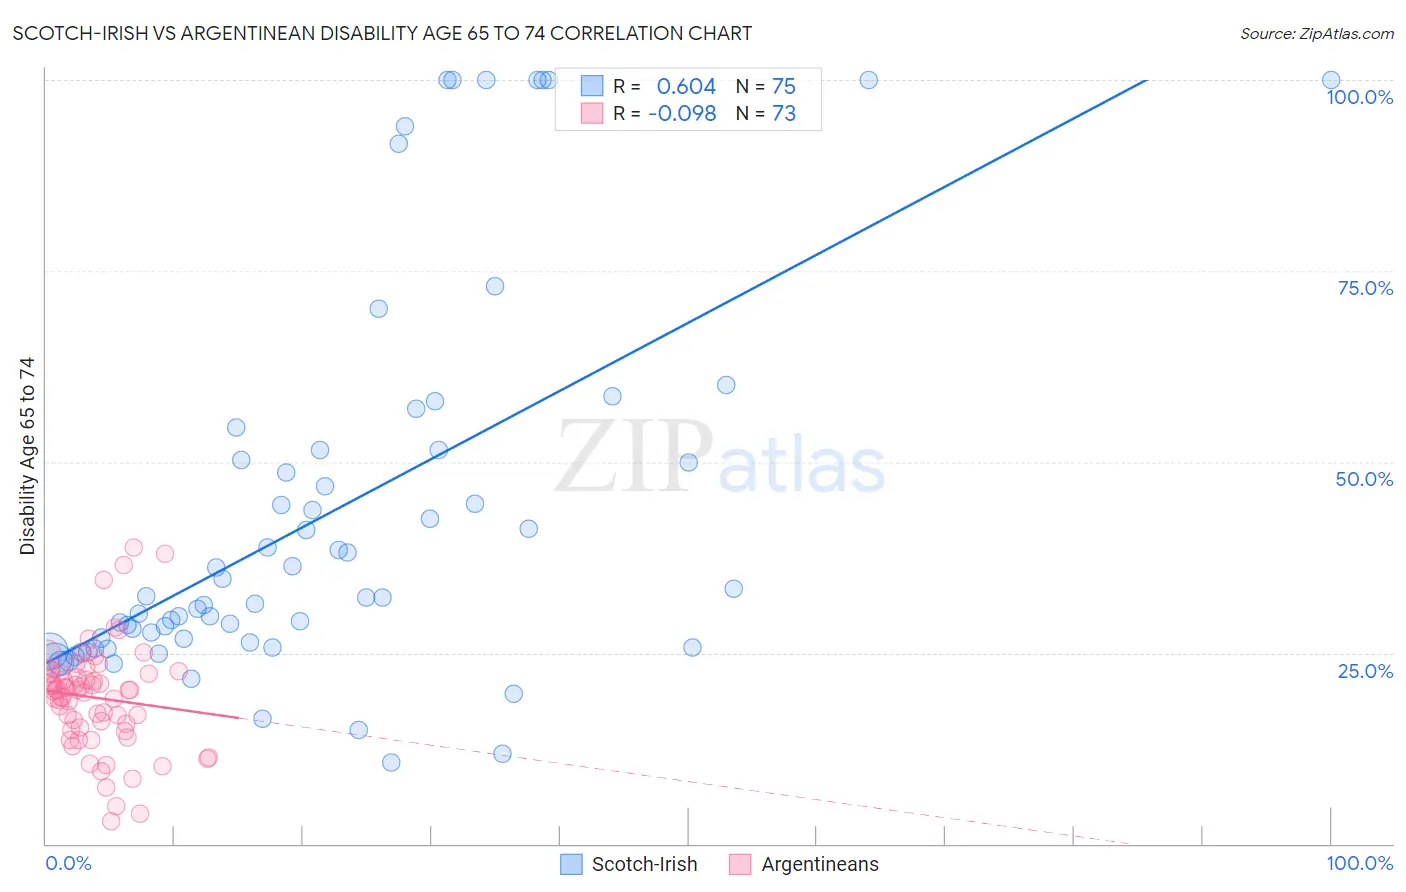
Scotch-Irish vs Argentinean Disability Age 65 to 74 Correlation Chart
The statistical analysis conducted on geographies consisting of 546,992,221 people shows a significant positive correlation between the proportion of Scotch-Irish and percentage of population with a disability between the ages 65 and 75 in the United States with a correlation coefficient (R) of 0.604 and weighted average of 24.4%. Similarly, the statistical analysis conducted on geographies consisting of 296,790,754 people shows a slight negative correlation between the proportion of Argentineans and percentage of population with a disability between the ages 65 and 75 in the United States with a correlation coefficient (R) of -0.098 and weighted average of 21.2%, a difference of 15.3%.
Disability Age 65 to 74 Correlation Summary
| Measurement | Scotch-Irish | Argentinean |
| Minimum | 10.7% | 2.9% |
| Maximum | 100.0% | 38.9% |
| Range | 89.3% | 36.0% |
| Mean | 43.1% | 19.1% |
| Median | 32.3% | 20.1% |
| Interquartile 25% (IQ1) | 25.8% | 15.1% |
| Interquartile 75% (IQ3) | 51.5% | 22.4% |
| Interquartile Range (IQR) | 25.7% | 7.3% |
| Standard Deviation (Sample) | 25.2% | 6.9% |
| Standard Deviation (Population) | 25.0% | 6.9% |
Similar Demographics by Disability Age 65 to 74
Demographics Similar to Scotch-Irish by Disability Age 65 to 74
In terms of disability age 65 to 74, the demographic groups most similar to Scotch-Irish are German Russian (24.4%, a difference of 0.040%), West Indian (24.5%, a difference of 0.14%), Panamanian (24.4%, a difference of 0.16%), Bahamian (24.4%, a difference of 0.26%), and Immigrants from Ghana (24.5%, a difference of 0.31%).
| Demographics | Rating | Rank | Disability Age 65 to 74 |
| Whites/Caucasians | 6.6 /100 | #228 | Tragic 24.2% |
| Celtics | 6.4 /100 | #229 | Tragic 24.2% |
| Barbadians | 6.0 /100 | #230 | Tragic 24.3% |
| Immigrants | Thailand | 5.2 /100 | #231 | Tragic 24.3% |
| Immigrants | Zaire | 5.0 /100 | #232 | Tragic 24.3% |
| Bahamians | 4.5 /100 | #233 | Tragic 24.4% |
| Panamanians | 4.2 /100 | #234 | Tragic 24.4% |
| Scotch-Irish | 3.8 /100 | #235 | Tragic 24.4% |
| German Russians | 3.7 /100 | #236 | Tragic 24.4% |
| West Indians | 3.4 /100 | #237 | Tragic 24.5% |
| Immigrants | Ghana | 3.0 /100 | #238 | Tragic 24.5% |
| Immigrants | Caribbean | 2.6 /100 | #239 | Tragic 24.6% |
| Spaniards | 2.4 /100 | #240 | Tragic 24.6% |
| Immigrants | Western Africa | 2.3 /100 | #241 | Tragic 24.6% |
| Immigrants | Senegal | 2.2 /100 | #242 | Tragic 24.6% |
Demographics Similar to Argentineans by Disability Age 65 to 74
In terms of disability age 65 to 74, the demographic groups most similar to Argentineans are Latvian (21.2%, a difference of 0.16%), Russian (21.2%, a difference of 0.18%), Israeli (21.2%, a difference of 0.19%), Immigrants from Austria (21.2%, a difference of 0.23%), and Immigrants from Switzerland (21.1%, a difference of 0.29%).
| Demographics | Rating | Rank | Disability Age 65 to 74 |
| Turks | 99.9 /100 | #32 | Exceptional 21.0% |
| Immigrants | Argentina | 99.9 /100 | #33 | Exceptional 21.1% |
| Immigrants | Sri Lanka | 99.9 /100 | #34 | Exceptional 21.1% |
| Bulgarians | 99.9 /100 | #35 | Exceptional 21.1% |
| Immigrants | Switzerland | 99.8 /100 | #36 | Exceptional 21.1% |
| Israelis | 99.8 /100 | #37 | Exceptional 21.2% |
| Russians | 99.8 /100 | #38 | Exceptional 21.2% |
| Argentineans | 99.8 /100 | #39 | Exceptional 21.2% |
| Latvians | 99.8 /100 | #40 | Exceptional 21.2% |
| Immigrants | Austria | 99.8 /100 | #41 | Exceptional 21.2% |
| Macedonians | 99.7 /100 | #42 | Exceptional 21.3% |
| Immigrants | Croatia | 99.7 /100 | #43 | Exceptional 21.3% |
| Estonians | 99.7 /100 | #44 | Exceptional 21.4% |
| Asians | 99.7 /100 | #45 | Exceptional 21.4% |
| Immigrants | Turkey | 99.7 /100 | #46 | Exceptional 21.4% |