Scotch-Irish vs Osage Disability Age 65 to 74
COMPARE
Scotch-Irish
Osage
Disability Age 65 to 74
Disability Age 65 to 74 Comparison
Scotch-Irish
Osage
24.4%
DISABILITY AGE 65 TO 74
3.8/ 100
METRIC RATING
235th/ 347
METRIC RANK
27.5%
DISABILITY AGE 65 TO 74
0.0/ 100
METRIC RATING
312th/ 347
METRIC RANK
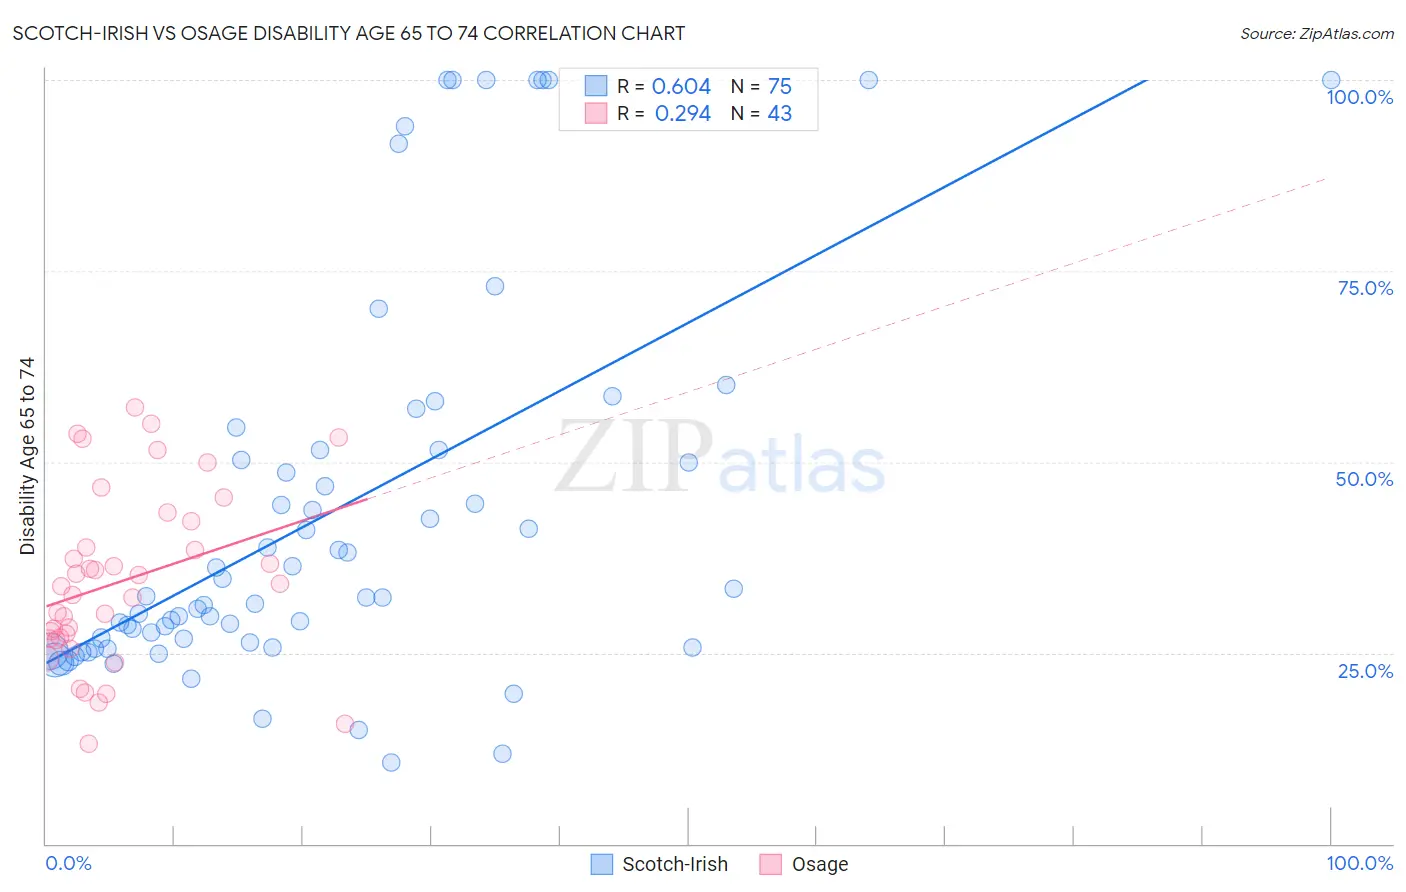
Scotch-Irish vs Osage Disability Age 65 to 74 Correlation Chart
The statistical analysis conducted on geographies consisting of 546,992,221 people shows a significant positive correlation between the proportion of Scotch-Irish and percentage of population with a disability between the ages 65 and 75 in the United States with a correlation coefficient (R) of 0.604 and weighted average of 24.4%. Similarly, the statistical analysis conducted on geographies consisting of 91,763,527 people shows a weak positive correlation between the proportion of Osage and percentage of population with a disability between the ages 65 and 75 in the United States with a correlation coefficient (R) of 0.294 and weighted average of 27.5%, a difference of 12.4%.
Disability Age 65 to 74 Correlation Summary
| Measurement | Scotch-Irish | Osage |
| Minimum | 10.7% | 13.0% |
| Maximum | 100.0% | 57.1% |
| Range | 89.3% | 44.1% |
| Mean | 43.1% | 34.3% |
| Median | 32.3% | 33.7% |
| Interquartile 25% (IQ1) | 25.8% | 26.8% |
| Interquartile 75% (IQ3) | 51.5% | 42.2% |
| Interquartile Range (IQR) | 25.7% | 15.4% |
| Standard Deviation (Sample) | 25.2% | 11.3% |
| Standard Deviation (Population) | 25.0% | 11.2% |
Similar Demographics by Disability Age 65 to 74
Demographics Similar to Scotch-Irish by Disability Age 65 to 74
In terms of disability age 65 to 74, the demographic groups most similar to Scotch-Irish are German Russian (24.4%, a difference of 0.040%), West Indian (24.5%, a difference of 0.14%), Panamanian (24.4%, a difference of 0.16%), Bahamian (24.4%, a difference of 0.26%), and Immigrants from Ghana (24.5%, a difference of 0.31%).
| Demographics | Rating | Rank | Disability Age 65 to 74 |
| Whites/Caucasians | 6.6 /100 | #228 | Tragic 24.2% |
| Celtics | 6.4 /100 | #229 | Tragic 24.2% |
| Barbadians | 6.0 /100 | #230 | Tragic 24.3% |
| Immigrants | Thailand | 5.2 /100 | #231 | Tragic 24.3% |
| Immigrants | Zaire | 5.0 /100 | #232 | Tragic 24.3% |
| Bahamians | 4.5 /100 | #233 | Tragic 24.4% |
| Panamanians | 4.2 /100 | #234 | Tragic 24.4% |
| Scotch-Irish | 3.8 /100 | #235 | Tragic 24.4% |
| German Russians | 3.7 /100 | #236 | Tragic 24.4% |
| West Indians | 3.4 /100 | #237 | Tragic 24.5% |
| Immigrants | Ghana | 3.0 /100 | #238 | Tragic 24.5% |
| Immigrants | Caribbean | 2.6 /100 | #239 | Tragic 24.6% |
| Spaniards | 2.4 /100 | #240 | Tragic 24.6% |
| Immigrants | Western Africa | 2.3 /100 | #241 | Tragic 24.6% |
| Immigrants | Senegal | 2.2 /100 | #242 | Tragic 24.6% |
Demographics Similar to Osage by Disability Age 65 to 74
In terms of disability age 65 to 74, the demographic groups most similar to Osage are Menominee (27.4%, a difference of 0.080%), Shoshone (27.4%, a difference of 0.30%), Yaqui (27.4%, a difference of 0.35%), Sioux (27.3%, a difference of 0.41%), and Ute (27.3%, a difference of 0.56%).
| Demographics | Rating | Rank | Disability Age 65 to 74 |
| Mexicans | 0.0 /100 | #305 | Tragic 27.2% |
| Blacks/African Americans | 0.0 /100 | #306 | Tragic 27.3% |
| Ute | 0.0 /100 | #307 | Tragic 27.3% |
| Sioux | 0.0 /100 | #308 | Tragic 27.3% |
| Yaqui | 0.0 /100 | #309 | Tragic 27.4% |
| Shoshone | 0.0 /100 | #310 | Tragic 27.4% |
| Menominee | 0.0 /100 | #311 | Tragic 27.4% |
| Osage | 0.0 /100 | #312 | Tragic 27.5% |
| Paiute | 0.0 /100 | #313 | Tragic 27.8% |
| Chippewa | 0.0 /100 | #314 | Tragic 27.8% |
| Cajuns | 0.0 /100 | #315 | Tragic 27.9% |
| Crow | 0.0 /100 | #316 | Tragic 27.9% |
| Immigrants | Armenia | 0.0 /100 | #317 | Tragic 28.0% |
| Nepalese | 0.0 /100 | #318 | Tragic 28.0% |
| Arapaho | 0.0 /100 | #319 | Tragic 28.1% |