Scotch-Irish vs Cheyenne Disability Age 65 to 74
COMPARE
Scotch-Irish
Cheyenne
Disability Age 65 to 74
Disability Age 65 to 74 Comparison
Scotch-Irish
Cheyenne
24.4%
DISABILITY AGE 65 TO 74
3.8/ 100
METRIC RATING
235th/ 347
METRIC RANK
31.1%
DISABILITY AGE 65 TO 74
0.0/ 100
METRIC RATING
335th/ 347
METRIC RANK
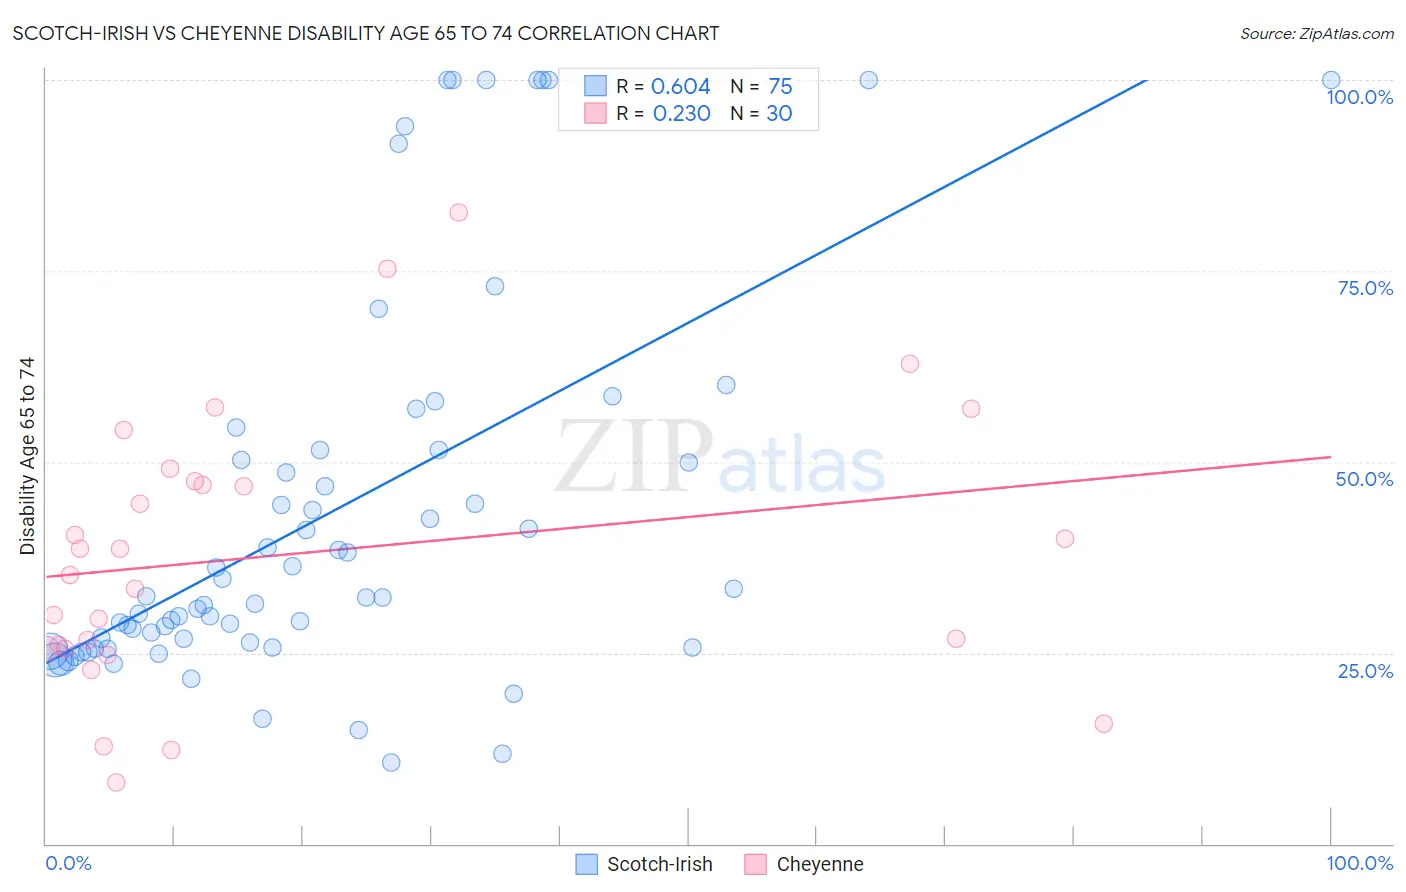
Scotch-Irish vs Cheyenne Disability Age 65 to 74 Correlation Chart
The statistical analysis conducted on geographies consisting of 546,992,221 people shows a significant positive correlation between the proportion of Scotch-Irish and percentage of population with a disability between the ages 65 and 75 in the United States with a correlation coefficient (R) of 0.604 and weighted average of 24.4%. Similarly, the statistical analysis conducted on geographies consisting of 80,698,325 people shows a weak positive correlation between the proportion of Cheyenne and percentage of population with a disability between the ages 65 and 75 in the United States with a correlation coefficient (R) of 0.230 and weighted average of 31.1%, a difference of 27.1%.
Disability Age 65 to 74 Correlation Summary
| Measurement | Scotch-Irish | Cheyenne |
| Minimum | 10.7% | 8.0% |
| Maximum | 100.0% | 82.6% |
| Range | 89.3% | 74.6% |
| Mean | 43.1% | 37.9% |
| Median | 32.3% | 36.9% |
| Interquartile 25% (IQ1) | 25.8% | 25.5% |
| Interquartile 75% (IQ3) | 51.5% | 47.5% |
| Interquartile Range (IQR) | 25.7% | 22.0% |
| Standard Deviation (Sample) | 25.2% | 18.0% |
| Standard Deviation (Population) | 25.0% | 17.7% |
Similar Demographics by Disability Age 65 to 74
Demographics Similar to Scotch-Irish by Disability Age 65 to 74
In terms of disability age 65 to 74, the demographic groups most similar to Scotch-Irish are German Russian (24.4%, a difference of 0.040%), West Indian (24.5%, a difference of 0.14%), Panamanian (24.4%, a difference of 0.16%), Bahamian (24.4%, a difference of 0.26%), and Immigrants from Ghana (24.5%, a difference of 0.31%).
| Demographics | Rating | Rank | Disability Age 65 to 74 |
| Whites/Caucasians | 6.6 /100 | #228 | Tragic 24.2% |
| Celtics | 6.4 /100 | #229 | Tragic 24.2% |
| Barbadians | 6.0 /100 | #230 | Tragic 24.3% |
| Immigrants | Thailand | 5.2 /100 | #231 | Tragic 24.3% |
| Immigrants | Zaire | 5.0 /100 | #232 | Tragic 24.3% |
| Bahamians | 4.5 /100 | #233 | Tragic 24.4% |
| Panamanians | 4.2 /100 | #234 | Tragic 24.4% |
| Scotch-Irish | 3.8 /100 | #235 | Tragic 24.4% |
| German Russians | 3.7 /100 | #236 | Tragic 24.4% |
| West Indians | 3.4 /100 | #237 | Tragic 24.5% |
| Immigrants | Ghana | 3.0 /100 | #238 | Tragic 24.5% |
| Immigrants | Caribbean | 2.6 /100 | #239 | Tragic 24.6% |
| Spaniards | 2.4 /100 | #240 | Tragic 24.6% |
| Immigrants | Western Africa | 2.3 /100 | #241 | Tragic 24.6% |
| Immigrants | Senegal | 2.2 /100 | #242 | Tragic 24.6% |
Demographics Similar to Cheyenne by Disability Age 65 to 74
In terms of disability age 65 to 74, the demographic groups most similar to Cheyenne are Yuman (31.5%, a difference of 1.3%), Alaska Native (30.6%, a difference of 1.4%), Colville (30.5%, a difference of 1.7%), Native/Alaskan (30.4%, a difference of 2.2%), and Chickasaw (30.2%, a difference of 2.9%).
| Demographics | Rating | Rank | Disability Age 65 to 74 |
| Hopi | 0.0 /100 | #328 | Tragic 30.0% |
| Choctaw | 0.0 /100 | #329 | Tragic 30.2% |
| Creek | 0.0 /100 | #330 | Tragic 30.2% |
| Chickasaw | 0.0 /100 | #331 | Tragic 30.2% |
| Natives/Alaskans | 0.0 /100 | #332 | Tragic 30.4% |
| Colville | 0.0 /100 | #333 | Tragic 30.5% |
| Alaska Natives | 0.0 /100 | #334 | Tragic 30.6% |
| Cheyenne | 0.0 /100 | #335 | Tragic 31.1% |
| Yuman | 0.0 /100 | #336 | Tragic 31.5% |
| Houma | 0.0 /100 | #337 | Tragic 32.3% |
| Alaskan Athabascans | 0.0 /100 | #338 | Tragic 32.4% |
| Kiowa | 0.0 /100 | #339 | Tragic 32.6% |
| Lumbee | 0.0 /100 | #340 | Tragic 32.7% |
| Tsimshian | 0.0 /100 | #341 | Tragic 32.9% |
| Pueblo | 0.0 /100 | #342 | Tragic 33.1% |