Croatian vs Immigrants from Iran Female Disability
COMPARE
Croatian
Immigrants from Iran
Female Disability
Female Disability Comparison
Croatians
Immigrants from Iran
12.4%
FEMALE DISABILITY
20.2/ 100
METRIC RATING
207th/ 347
METRIC RANK
10.8%
FEMALE DISABILITY
100.0/ 100
METRIC RATING
18th/ 347
METRIC RANK
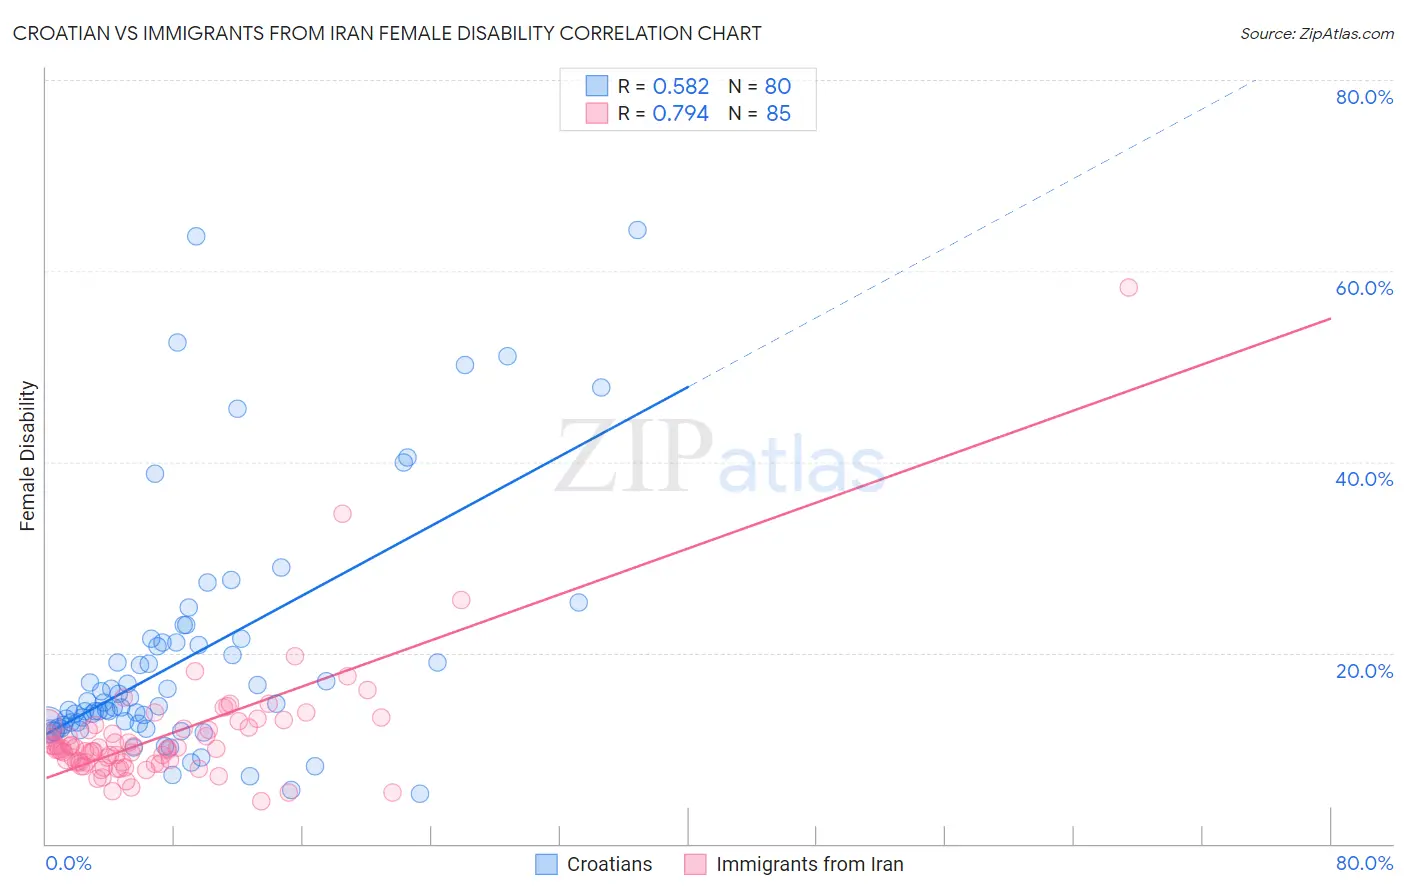
Croatian vs Immigrants from Iran Female Disability Correlation Chart
The statistical analysis conducted on geographies consisting of 375,696,225 people shows a substantial positive correlation between the proportion of Croatians and percentage of females with a disability in the United States with a correlation coefficient (R) of 0.582 and weighted average of 12.4%. Similarly, the statistical analysis conducted on geographies consisting of 279,884,220 people shows a strong positive correlation between the proportion of Immigrants from Iran and percentage of females with a disability in the United States with a correlation coefficient (R) of 0.794 and weighted average of 10.8%, a difference of 14.1%.
Female Disability Correlation Summary
| Measurement | Croatian | Immigrants from Iran |
| Minimum | 5.2% | 4.5% |
| Maximum | 64.3% | 58.2% |
| Range | 59.1% | 53.8% |
| Mean | 19.5% | 11.3% |
| Median | 14.5% | 9.9% |
| Interquartile 25% (IQ1) | 12.4% | 8.5% |
| Interquartile 75% (IQ3) | 21.1% | 12.1% |
| Interquartile Range (IQR) | 8.7% | 3.6% |
| Standard Deviation (Sample) | 12.7% | 6.6% |
| Standard Deviation (Population) | 12.6% | 6.6% |
Similar Demographics by Female Disability
Demographics Similar to Croatians by Female Disability
In terms of female disability, the demographic groups most similar to Croatians are Immigrants from Cuba (12.4%, a difference of 0.0%), Immigrants from Grenada (12.4%, a difference of 0.020%), Immigrants from Zaire (12.3%, a difference of 0.040%), Immigrants from Barbados (12.3%, a difference of 0.050%), and Somali (12.3%, a difference of 0.080%).
| Demographics | Rating | Rank | Female Disability |
| Trinidadians and Tobagonians | 22.4 /100 | #200 | Fair 12.3% |
| Chinese | 22.1 /100 | #201 | Fair 12.3% |
| Somalis | 21.5 /100 | #202 | Fair 12.3% |
| Immigrants | Barbados | 21.1 /100 | #203 | Fair 12.3% |
| Immigrants | Zaire | 20.9 /100 | #204 | Fair 12.3% |
| Immigrants | Grenada | 20.5 /100 | #205 | Fair 12.4% |
| Immigrants | Cuba | 20.2 /100 | #206 | Fair 12.4% |
| Croatians | 20.2 /100 | #207 | Fair 12.4% |
| Basques | 17.5 /100 | #208 | Poor 12.4% |
| Mexicans | 15.7 /100 | #209 | Poor 12.4% |
| Swiss | 14.9 /100 | #210 | Poor 12.4% |
| Immigrants | Bosnia and Herzegovina | 14.8 /100 | #211 | Poor 12.4% |
| Ute | 14.7 /100 | #212 | Poor 12.4% |
| Immigrants | Thailand | 14.5 /100 | #213 | Poor 12.4% |
| Panamanians | 13.5 /100 | #214 | Poor 12.4% |
Demographics Similar to Immigrants from Iran by Female Disability
In terms of female disability, the demographic groups most similar to Immigrants from Iran are Immigrants from Venezuela (10.9%, a difference of 0.21%), Indian (Asian) (10.8%, a difference of 0.38%), Immigrants from Pakistan (10.9%, a difference of 0.39%), Okinawan (10.8%, a difference of 0.70%), and Asian (10.9%, a difference of 0.75%).
| Demographics | Rating | Rank | Female Disability |
| Immigrants | Korea | 100.0 /100 | #11 | Exceptional 10.6% |
| Immigrants | Israel | 100.0 /100 | #12 | Exceptional 10.7% |
| Immigrants | Eastern Asia | 100.0 /100 | #13 | Exceptional 10.7% |
| Immigrants | China | 100.0 /100 | #14 | Exceptional 10.7% |
| Burmese | 100.0 /100 | #15 | Exceptional 10.7% |
| Okinawans | 100.0 /100 | #16 | Exceptional 10.8% |
| Indians (Asian) | 100.0 /100 | #17 | Exceptional 10.8% |
| Immigrants | Iran | 100.0 /100 | #18 | Exceptional 10.8% |
| Immigrants | Venezuela | 100.0 /100 | #19 | Exceptional 10.9% |
| Immigrants | Pakistan | 100.0 /100 | #20 | Exceptional 10.9% |
| Asians | 100.0 /100 | #21 | Exceptional 10.9% |
| Immigrants | Sri Lanka | 100.0 /100 | #22 | Exceptional 10.9% |
| Venezuelans | 100.0 /100 | #23 | Exceptional 11.0% |
| Immigrants | Argentina | 100.0 /100 | #24 | Exceptional 11.0% |
| Immigrants | Asia | 100.0 /100 | #25 | Exceptional 11.0% |