Croatian vs Immigrants from Guyana Female Disability
COMPARE
Croatian
Immigrants from Guyana
Female Disability
Female Disability Comparison
Croatians
Immigrants from Guyana
12.4%
FEMALE DISABILITY
20.2/ 100
METRIC RATING
207th/ 347
METRIC RANK
12.2%
FEMALE DISABILITY
43.1/ 100
METRIC RATING
176th/ 347
METRIC RANK
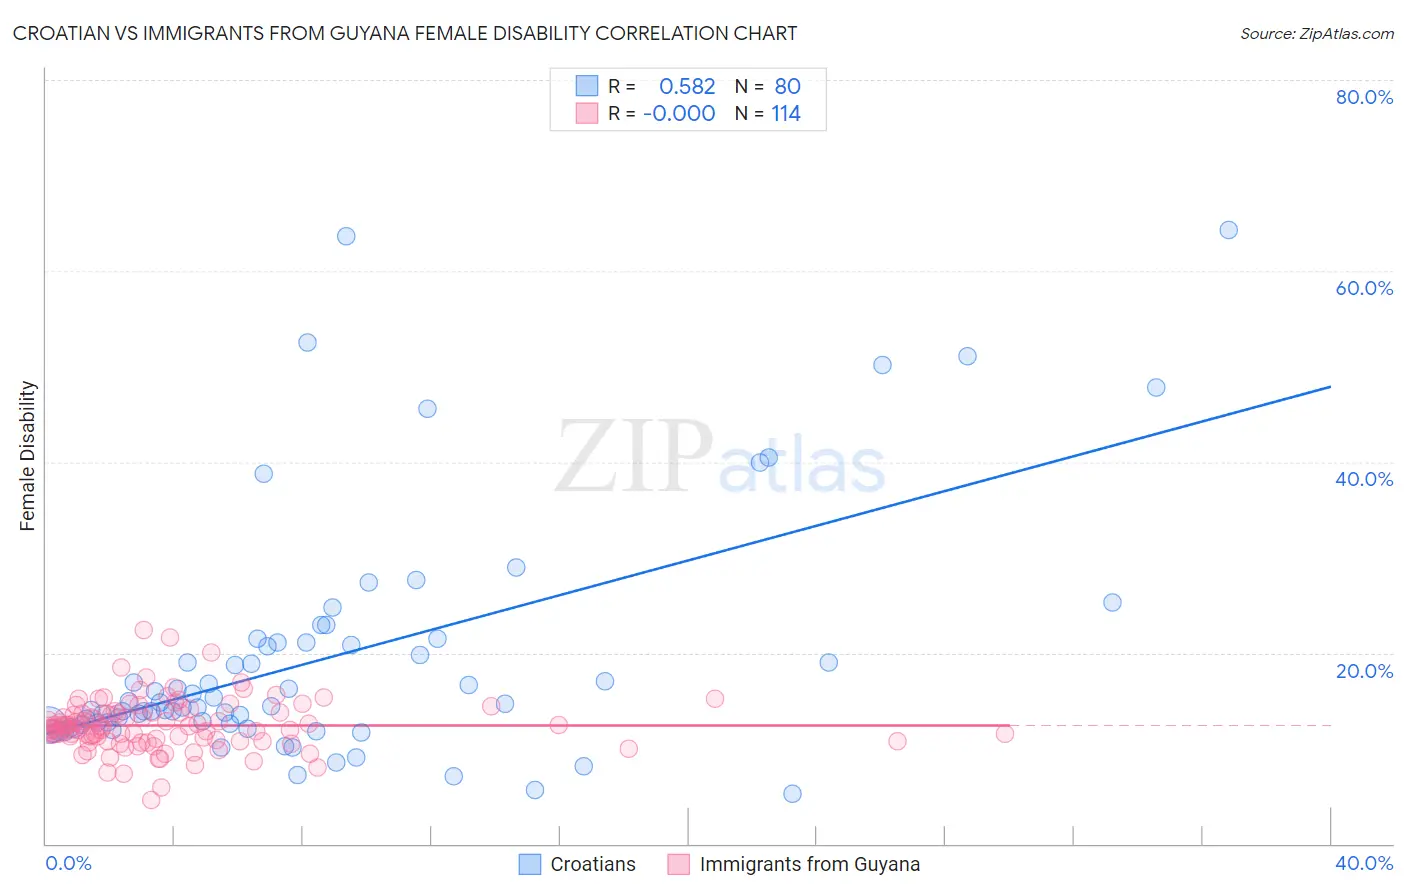
Croatian vs Immigrants from Guyana Female Disability Correlation Chart
The statistical analysis conducted on geographies consisting of 375,696,225 people shows a substantial positive correlation between the proportion of Croatians and percentage of females with a disability in the United States with a correlation coefficient (R) of 0.582 and weighted average of 12.4%. Similarly, the statistical analysis conducted on geographies consisting of 183,713,039 people shows no correlation between the proportion of Immigrants from Guyana and percentage of females with a disability in the United States with a correlation coefficient (R) of -0.000 and weighted average of 12.2%, a difference of 1.0%.
Female Disability Correlation Summary
| Measurement | Croatian | Immigrants from Guyana |
| Minimum | 5.2% | 4.6% |
| Maximum | 64.3% | 22.4% |
| Range | 59.1% | 17.8% |
| Mean | 19.5% | 12.4% |
| Median | 14.5% | 12.2% |
| Interquartile 25% (IQ1) | 12.4% | 10.8% |
| Interquartile 75% (IQ3) | 21.1% | 13.7% |
| Interquartile Range (IQR) | 8.7% | 2.9% |
| Standard Deviation (Sample) | 12.7% | 2.7% |
| Standard Deviation (Population) | 12.6% | 2.7% |
Similar Demographics by Female Disability
Demographics Similar to Croatians by Female Disability
In terms of female disability, the demographic groups most similar to Croatians are Immigrants from Cuba (12.4%, a difference of 0.0%), Immigrants from Grenada (12.4%, a difference of 0.020%), Immigrants from Zaire (12.3%, a difference of 0.040%), Immigrants from Barbados (12.3%, a difference of 0.050%), and Somali (12.3%, a difference of 0.080%).
| Demographics | Rating | Rank | Female Disability |
| Trinidadians and Tobagonians | 22.4 /100 | #200 | Fair 12.3% |
| Chinese | 22.1 /100 | #201 | Fair 12.3% |
| Somalis | 21.5 /100 | #202 | Fair 12.3% |
| Immigrants | Barbados | 21.1 /100 | #203 | Fair 12.3% |
| Immigrants | Zaire | 20.9 /100 | #204 | Fair 12.3% |
| Immigrants | Grenada | 20.5 /100 | #205 | Fair 12.4% |
| Immigrants | Cuba | 20.2 /100 | #206 | Fair 12.4% |
| Croatians | 20.2 /100 | #207 | Fair 12.4% |
| Basques | 17.5 /100 | #208 | Poor 12.4% |
| Mexicans | 15.7 /100 | #209 | Poor 12.4% |
| Swiss | 14.9 /100 | #210 | Poor 12.4% |
| Immigrants | Bosnia and Herzegovina | 14.8 /100 | #211 | Poor 12.4% |
| Ute | 14.7 /100 | #212 | Poor 12.4% |
| Immigrants | Thailand | 14.5 /100 | #213 | Poor 12.4% |
| Panamanians | 13.5 /100 | #214 | Poor 12.4% |
Demographics Similar to Immigrants from Guyana by Female Disability
In terms of female disability, the demographic groups most similar to Immigrants from Guyana are Immigrants from Ghana (12.2%, a difference of 0.030%), Immigrants from Western Europe (12.2%, a difference of 0.080%), Immigrants from Fiji (12.3%, a difference of 0.19%), Albanian (12.3%, a difference of 0.20%), and Immigrants from Canada (12.3%, a difference of 0.23%).
| Demographics | Rating | Rank | Female Disability |
| Lebanese | 58.1 /100 | #169 | Average 12.2% |
| Maltese | 57.0 /100 | #170 | Average 12.2% |
| Immigrants | Southern Europe | 56.3 /100 | #171 | Average 12.2% |
| Haitians | 51.9 /100 | #172 | Average 12.2% |
| Immigrants | Mexico | 50.8 /100 | #173 | Average 12.2% |
| Immigrants | England | 50.0 /100 | #174 | Average 12.2% |
| Immigrants | St. Vincent and the Grenadines | 49.7 /100 | #175 | Average 12.2% |
| Immigrants | Guyana | 43.1 /100 | #176 | Average 12.2% |
| Immigrants | Ghana | 42.5 /100 | #177 | Average 12.2% |
| Immigrants | Western Europe | 40.9 /100 | #178 | Average 12.2% |
| Immigrants | Fiji | 38.2 /100 | #179 | Fair 12.3% |
| Albanians | 37.9 /100 | #180 | Fair 12.3% |
| Immigrants | Canada | 37.2 /100 | #181 | Fair 12.3% |
| Norwegians | 36.9 /100 | #182 | Fair 12.3% |
| Cubans | 36.5 /100 | #183 | Fair 12.3% |