Croatian vs Latvian Female Disability
COMPARE
Croatian
Latvian
Female Disability
Female Disability Comparison
Croatians
Latvians
12.4%
FEMALE DISABILITY
20.2/ 100
METRIC RATING
207th/ 347
METRIC RANK
11.7%
FEMALE DISABILITY
98.2/ 100
METRIC RATING
107th/ 347
METRIC RANK
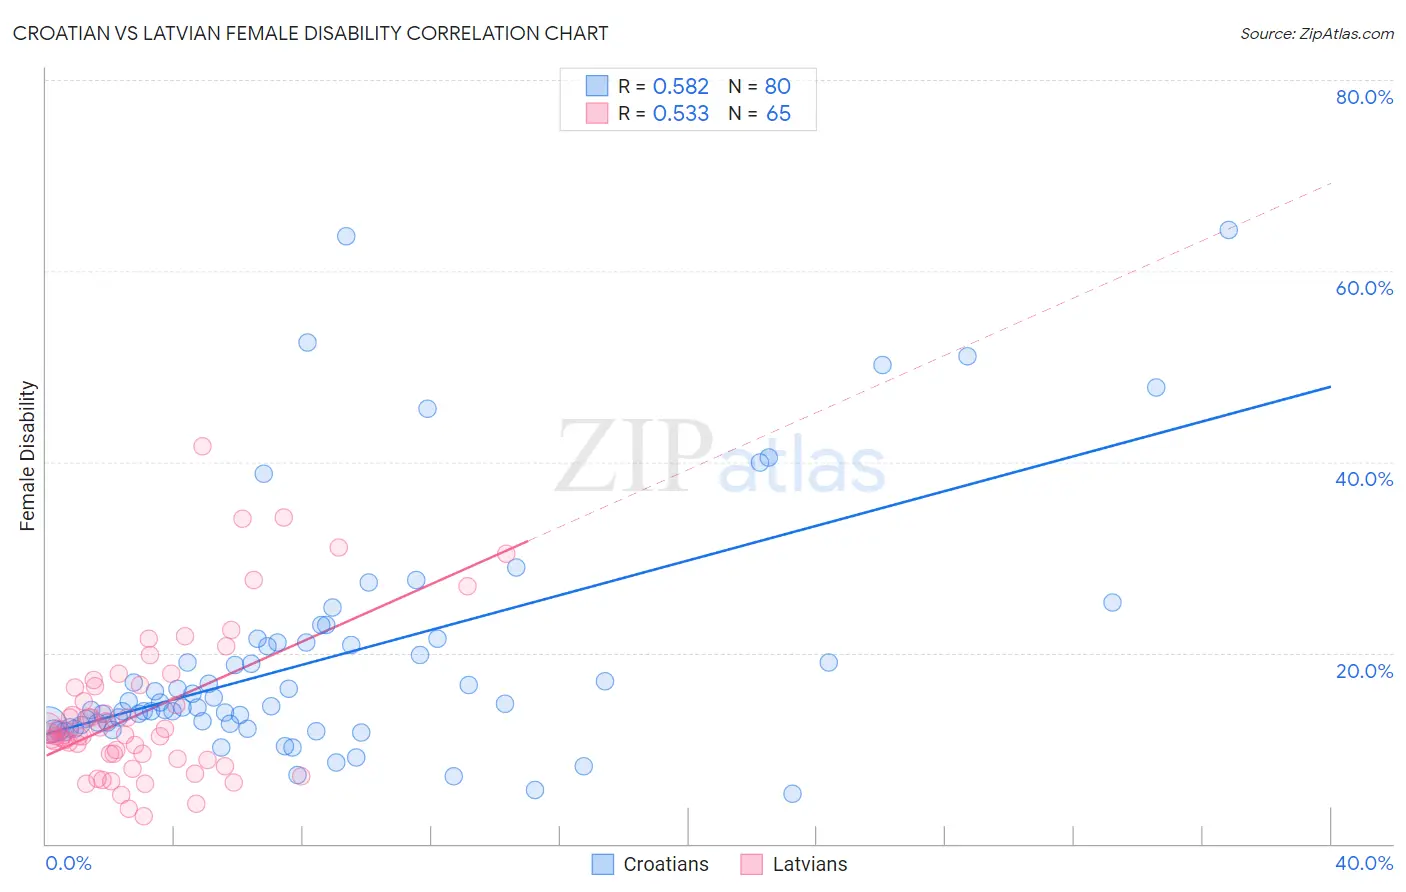
Croatian vs Latvian Female Disability Correlation Chart
The statistical analysis conducted on geographies consisting of 375,696,225 people shows a substantial positive correlation between the proportion of Croatians and percentage of females with a disability in the United States with a correlation coefficient (R) of 0.582 and weighted average of 12.4%. Similarly, the statistical analysis conducted on geographies consisting of 220,713,826 people shows a substantial positive correlation between the proportion of Latvians and percentage of females with a disability in the United States with a correlation coefficient (R) of 0.533 and weighted average of 11.7%, a difference of 5.2%.
Female Disability Correlation Summary
| Measurement | Croatian | Latvian |
| Minimum | 5.2% | 2.8% |
| Maximum | 64.3% | 41.7% |
| Range | 59.1% | 38.8% |
| Mean | 19.5% | 13.9% |
| Median | 14.5% | 11.4% |
| Interquartile 25% (IQ1) | 12.4% | 9.1% |
| Interquartile 75% (IQ3) | 21.1% | 16.6% |
| Interquartile Range (IQR) | 8.7% | 7.5% |
| Standard Deviation (Sample) | 12.7% | 7.9% |
| Standard Deviation (Population) | 12.6% | 7.8% |
Similar Demographics by Female Disability
Demographics Similar to Croatians by Female Disability
In terms of female disability, the demographic groups most similar to Croatians are Immigrants from Cuba (12.4%, a difference of 0.0%), Immigrants from Grenada (12.4%, a difference of 0.020%), Immigrants from Zaire (12.3%, a difference of 0.040%), Immigrants from Barbados (12.3%, a difference of 0.050%), and Somali (12.3%, a difference of 0.080%).
| Demographics | Rating | Rank | Female Disability |
| Trinidadians and Tobagonians | 22.4 /100 | #200 | Fair 12.3% |
| Chinese | 22.1 /100 | #201 | Fair 12.3% |
| Somalis | 21.5 /100 | #202 | Fair 12.3% |
| Immigrants | Barbados | 21.1 /100 | #203 | Fair 12.3% |
| Immigrants | Zaire | 20.9 /100 | #204 | Fair 12.3% |
| Immigrants | Grenada | 20.5 /100 | #205 | Fair 12.4% |
| Immigrants | Cuba | 20.2 /100 | #206 | Fair 12.4% |
| Croatians | 20.2 /100 | #207 | Fair 12.4% |
| Basques | 17.5 /100 | #208 | Poor 12.4% |
| Mexicans | 15.7 /100 | #209 | Poor 12.4% |
| Swiss | 14.9 /100 | #210 | Poor 12.4% |
| Immigrants | Bosnia and Herzegovina | 14.8 /100 | #211 | Poor 12.4% |
| Ute | 14.7 /100 | #212 | Poor 12.4% |
| Immigrants | Thailand | 14.5 /100 | #213 | Poor 12.4% |
| Panamanians | 13.5 /100 | #214 | Poor 12.4% |
Demographics Similar to Latvians by Female Disability
In terms of female disability, the demographic groups most similar to Latvians are Immigrants from Greece (11.7%, a difference of 0.020%), New Zealander (11.7%, a difference of 0.020%), Australian (11.7%, a difference of 0.050%), Immigrants (11.7%, a difference of 0.050%), and Soviet Union (11.7%, a difference of 0.050%).
| Demographics | Rating | Rank | Female Disability |
| Immigrants | Uruguay | 98.5 /100 | #100 | Exceptional 11.7% |
| Immigrants | Costa Rica | 98.4 /100 | #101 | Exceptional 11.7% |
| Immigrants | South Eastern Asia | 98.4 /100 | #102 | Exceptional 11.7% |
| Immigrants | Eastern Africa | 98.3 /100 | #103 | Exceptional 11.7% |
| Immigrants | Western Asia | 98.3 /100 | #104 | Exceptional 11.7% |
| Australians | 98.3 /100 | #105 | Exceptional 11.7% |
| Immigrants | Greece | 98.2 /100 | #106 | Exceptional 11.7% |
| Latvians | 98.2 /100 | #107 | Exceptional 11.7% |
| New Zealanders | 98.1 /100 | #108 | Exceptional 11.7% |
| Immigrants | Immigrants | 98.1 /100 | #109 | Exceptional 11.7% |
| Soviet Union | 98.1 /100 | #110 | Exceptional 11.7% |
| Costa Ricans | 98.1 /100 | #111 | Exceptional 11.7% |
| Immigrants | Bangladesh | 97.8 /100 | #112 | Exceptional 11.8% |
| Immigrants | Belarus | 97.8 /100 | #113 | Exceptional 11.8% |
| South Africans | 97.7 /100 | #114 | Exceptional 11.8% |