African vs Immigrants from Trinidad and Tobago Female Disability
COMPARE
African
Immigrants from Trinidad and Tobago
Female Disability
Female Disability Comparison
Africans
Immigrants from Trinidad and Tobago
13.4%
FEMALE DISABILITY
0.0/ 100
METRIC RATING
301st/ 347
METRIC RANK
12.3%
FEMALE DISABILITY
24.7/ 100
METRIC RATING
199th/ 347
METRIC RANK
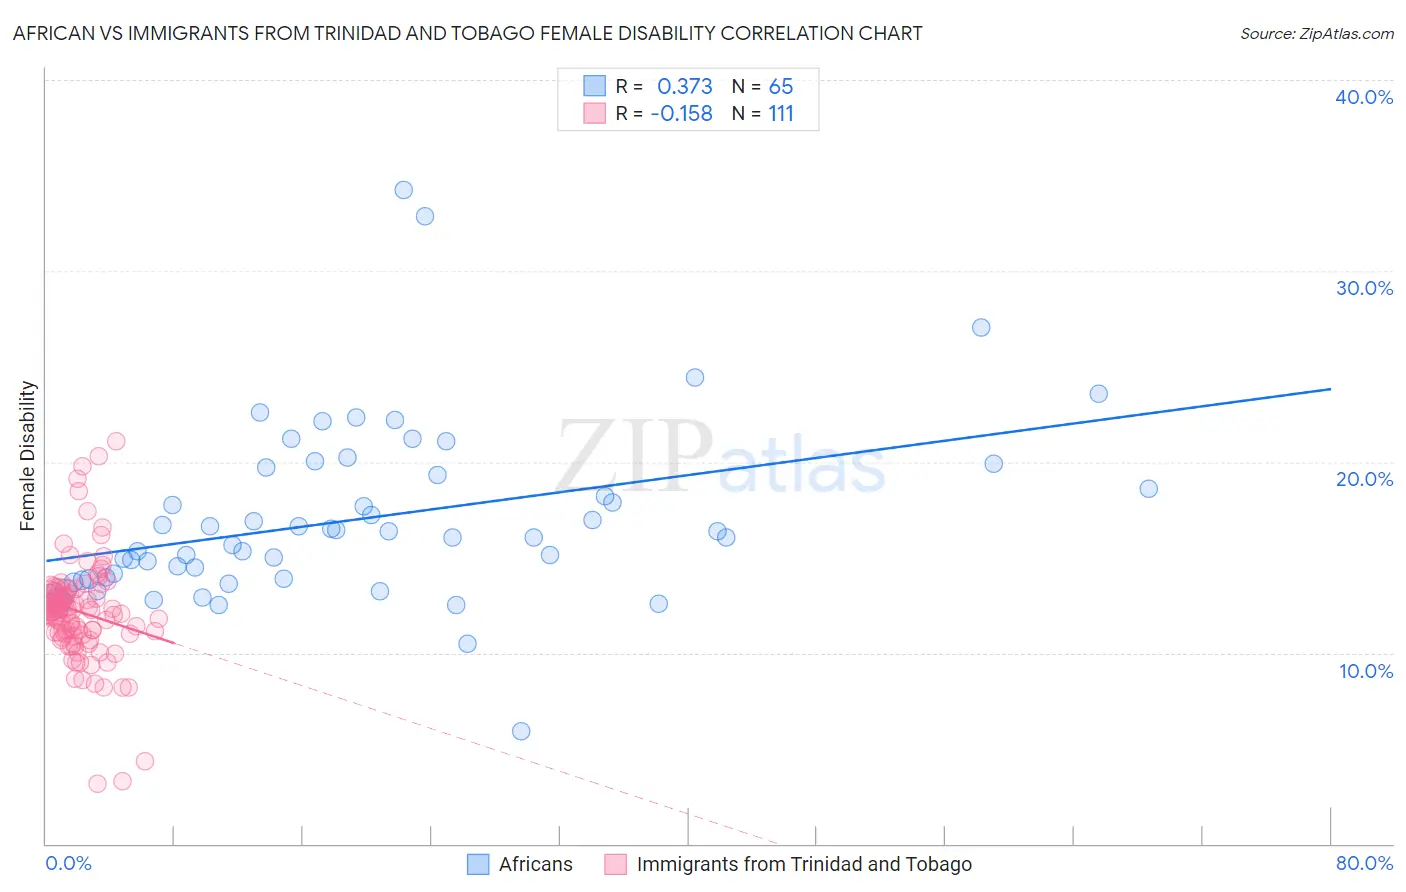
African vs Immigrants from Trinidad and Tobago Female Disability Correlation Chart
The statistical analysis conducted on geographies consisting of 469,943,278 people shows a mild positive correlation between the proportion of Africans and percentage of females with a disability in the United States with a correlation coefficient (R) of 0.373 and weighted average of 13.4%. Similarly, the statistical analysis conducted on geographies consisting of 223,503,313 people shows a poor negative correlation between the proportion of Immigrants from Trinidad and Tobago and percentage of females with a disability in the United States with a correlation coefficient (R) of -0.158 and weighted average of 12.3%, a difference of 9.0%.
Female Disability Correlation Summary
| Measurement | African | Immigrants from Trinidad and Tobago |
| Minimum | 5.9% | 3.2% |
| Maximum | 34.2% | 21.1% |
| Range | 28.4% | 17.9% |
| Mean | 17.0% | 12.1% |
| Median | 16.1% | 12.1% |
| Interquartile 25% (IQ1) | 13.9% | 11.0% |
| Interquartile 75% (IQ3) | 19.5% | 13.2% |
| Interquartile Range (IQR) | 5.6% | 2.3% |
| Standard Deviation (Sample) | 4.7% | 2.8% |
| Standard Deviation (Population) | 4.7% | 2.7% |
Similar Demographics by Female Disability
Demographics Similar to Africans by Female Disability
In terms of female disability, the demographic groups most similar to Africans are Scotch-Irish (13.4%, a difference of 0.14%), Immigrants from Portugal (13.5%, a difference of 0.14%), Immigrants from Micronesia (13.5%, a difference of 0.17%), Pennsylvania German (13.4%, a difference of 0.20%), and Immigrants from Dominican Republic (13.4%, a difference of 0.21%).
| Demographics | Rating | Rank | Female Disability |
| Celtics | 0.0 /100 | #294 | Tragic 13.3% |
| French | 0.0 /100 | #295 | Tragic 13.3% |
| Nepalese | 0.0 /100 | #296 | Tragic 13.3% |
| Slovaks | 0.0 /100 | #297 | Tragic 13.3% |
| Immigrants | Nonimmigrants | 0.0 /100 | #298 | Tragic 13.4% |
| Immigrants | Dominican Republic | 0.0 /100 | #299 | Tragic 13.4% |
| Pennsylvania Germans | 0.0 /100 | #300 | Tragic 13.4% |
| Africans | 0.0 /100 | #301 | Tragic 13.4% |
| Scotch-Irish | 0.0 /100 | #302 | Tragic 13.4% |
| Immigrants | Portugal | 0.0 /100 | #303 | Tragic 13.5% |
| Immigrants | Micronesia | 0.0 /100 | #304 | Tragic 13.5% |
| Dominicans | 0.0 /100 | #305 | Tragic 13.5% |
| French Canadians | 0.0 /100 | #306 | Tragic 13.6% |
| Central American Indians | 0.0 /100 | #307 | Tragic 13.6% |
| Cree | 0.0 /100 | #308 | Tragic 13.7% |
Demographics Similar to Immigrants from Trinidad and Tobago by Female Disability
In terms of female disability, the demographic groups most similar to Immigrants from Trinidad and Tobago are Mexican American Indian (12.3%, a difference of 0.010%), Immigrants from Panama (12.3%, a difference of 0.040%), Honduran (12.3%, a difference of 0.040%), Swedish (12.3%, a difference of 0.10%), and Ukrainian (12.3%, a difference of 0.12%).
| Demographics | Rating | Rank | Female Disability |
| Immigrants | Western Africa | 29.2 /100 | #192 | Fair 12.3% |
| Northern Europeans | 27.5 /100 | #193 | Fair 12.3% |
| Ukrainians | 27.2 /100 | #194 | Fair 12.3% |
| Swedes | 26.6 /100 | #195 | Fair 12.3% |
| Immigrants | Panama | 25.5 /100 | #196 | Fair 12.3% |
| Hondurans | 25.4 /100 | #197 | Fair 12.3% |
| Mexican American Indians | 24.9 /100 | #198 | Fair 12.3% |
| Immigrants | Trinidad and Tobago | 24.7 /100 | #199 | Fair 12.3% |
| Trinidadians and Tobagonians | 22.4 /100 | #200 | Fair 12.3% |
| Chinese | 22.1 /100 | #201 | Fair 12.3% |
| Somalis | 21.5 /100 | #202 | Fair 12.3% |
| Immigrants | Barbados | 21.1 /100 | #203 | Fair 12.3% |
| Immigrants | Zaire | 20.9 /100 | #204 | Fair 12.3% |
| Immigrants | Grenada | 20.5 /100 | #205 | Fair 12.4% |
| Immigrants | Cuba | 20.2 /100 | #206 | Fair 12.4% |