African vs Trinidadian and Tobagonian Female Disability
COMPARE
African
Trinidadian and Tobagonian
Female Disability
Female Disability Comparison
Africans
Trinidadians and Tobagonians
13.4%
FEMALE DISABILITY
0.0/ 100
METRIC RATING
301st/ 347
METRIC RANK
12.3%
FEMALE DISABILITY
22.4/ 100
METRIC RATING
200th/ 347
METRIC RANK
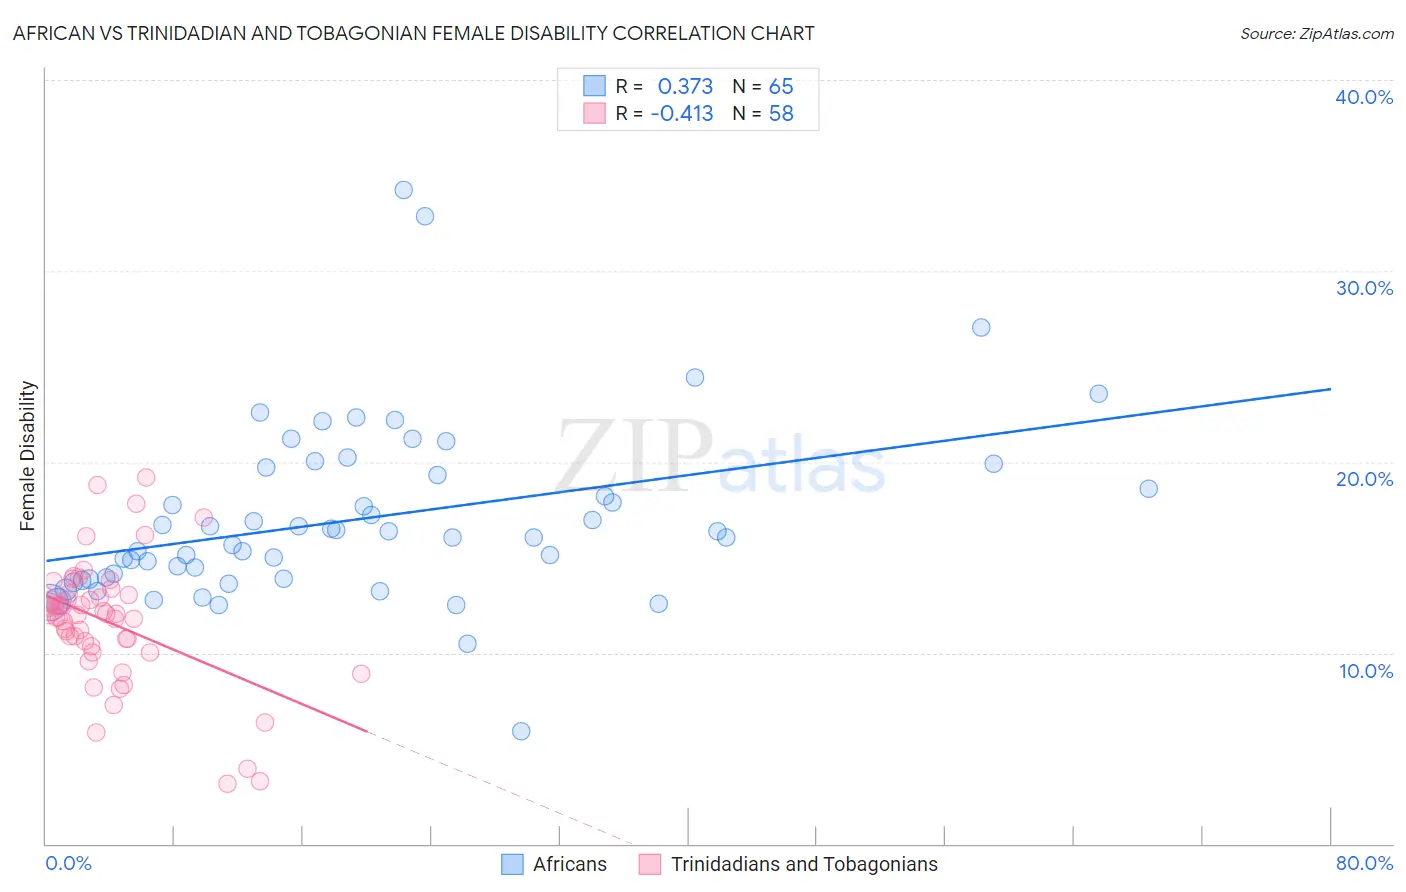
African vs Trinidadian and Tobagonian Female Disability Correlation Chart
The statistical analysis conducted on geographies consisting of 469,943,278 people shows a mild positive correlation between the proportion of Africans and percentage of females with a disability in the United States with a correlation coefficient (R) of 0.373 and weighted average of 13.4%. Similarly, the statistical analysis conducted on geographies consisting of 219,838,071 people shows a moderate negative correlation between the proportion of Trinidadians and Tobagonians and percentage of females with a disability in the United States with a correlation coefficient (R) of -0.413 and weighted average of 12.3%, a difference of 8.9%.
Female Disability Correlation Summary
| Measurement | African | Trinidadian and Tobagonian |
| Minimum | 5.9% | 3.2% |
| Maximum | 34.2% | 19.2% |
| Range | 28.4% | 16.0% |
| Mean | 17.0% | 11.6% |
| Median | 16.1% | 12.0% |
| Interquartile 25% (IQ1) | 13.9% | 10.3% |
| Interquartile 75% (IQ3) | 19.5% | 13.0% |
| Interquartile Range (IQR) | 5.6% | 2.7% |
| Standard Deviation (Sample) | 4.7% | 3.3% |
| Standard Deviation (Population) | 4.7% | 3.3% |
Similar Demographics by Female Disability
Demographics Similar to Africans by Female Disability
In terms of female disability, the demographic groups most similar to Africans are Scotch-Irish (13.4%, a difference of 0.14%), Immigrants from Portugal (13.5%, a difference of 0.14%), Immigrants from Micronesia (13.5%, a difference of 0.17%), Pennsylvania German (13.4%, a difference of 0.20%), and Immigrants from Dominican Republic (13.4%, a difference of 0.21%).
| Demographics | Rating | Rank | Female Disability |
| Celtics | 0.0 /100 | #294 | Tragic 13.3% |
| French | 0.0 /100 | #295 | Tragic 13.3% |
| Nepalese | 0.0 /100 | #296 | Tragic 13.3% |
| Slovaks | 0.0 /100 | #297 | Tragic 13.3% |
| Immigrants | Nonimmigrants | 0.0 /100 | #298 | Tragic 13.4% |
| Immigrants | Dominican Republic | 0.0 /100 | #299 | Tragic 13.4% |
| Pennsylvania Germans | 0.0 /100 | #300 | Tragic 13.4% |
| Africans | 0.0 /100 | #301 | Tragic 13.4% |
| Scotch-Irish | 0.0 /100 | #302 | Tragic 13.4% |
| Immigrants | Portugal | 0.0 /100 | #303 | Tragic 13.5% |
| Immigrants | Micronesia | 0.0 /100 | #304 | Tragic 13.5% |
| Dominicans | 0.0 /100 | #305 | Tragic 13.5% |
| French Canadians | 0.0 /100 | #306 | Tragic 13.6% |
| Central American Indians | 0.0 /100 | #307 | Tragic 13.6% |
| Cree | 0.0 /100 | #308 | Tragic 13.7% |
Demographics Similar to Trinidadians and Tobagonians by Female Disability
In terms of female disability, the demographic groups most similar to Trinidadians and Tobagonians are Chinese (12.3%, a difference of 0.010%), Somali (12.3%, a difference of 0.040%), Immigrants from Barbados (12.3%, a difference of 0.070%), Immigrants from Zaire (12.3%, a difference of 0.080%), and Immigrants from Grenada (12.4%, a difference of 0.10%).
| Demographics | Rating | Rank | Female Disability |
| Northern Europeans | 27.5 /100 | #193 | Fair 12.3% |
| Ukrainians | 27.2 /100 | #194 | Fair 12.3% |
| Swedes | 26.6 /100 | #195 | Fair 12.3% |
| Immigrants | Panama | 25.5 /100 | #196 | Fair 12.3% |
| Hondurans | 25.4 /100 | #197 | Fair 12.3% |
| Mexican American Indians | 24.9 /100 | #198 | Fair 12.3% |
| Immigrants | Trinidad and Tobago | 24.7 /100 | #199 | Fair 12.3% |
| Trinidadians and Tobagonians | 22.4 /100 | #200 | Fair 12.3% |
| Chinese | 22.1 /100 | #201 | Fair 12.3% |
| Somalis | 21.5 /100 | #202 | Fair 12.3% |
| Immigrants | Barbados | 21.1 /100 | #203 | Fair 12.3% |
| Immigrants | Zaire | 20.9 /100 | #204 | Fair 12.3% |
| Immigrants | Grenada | 20.5 /100 | #205 | Fair 12.4% |
| Immigrants | Cuba | 20.2 /100 | #206 | Fair 12.4% |
| Croatians | 20.2 /100 | #207 | Fair 12.4% |