African vs Pueblo Female Disability
COMPARE
African
Pueblo
Female Disability
Female Disability Comparison
Africans
Pueblo
13.4%
FEMALE DISABILITY
0.0/ 100
METRIC RATING
301st/ 347
METRIC RANK
14.1%
FEMALE DISABILITY
0.0/ 100
METRIC RATING
322nd/ 347
METRIC RANK
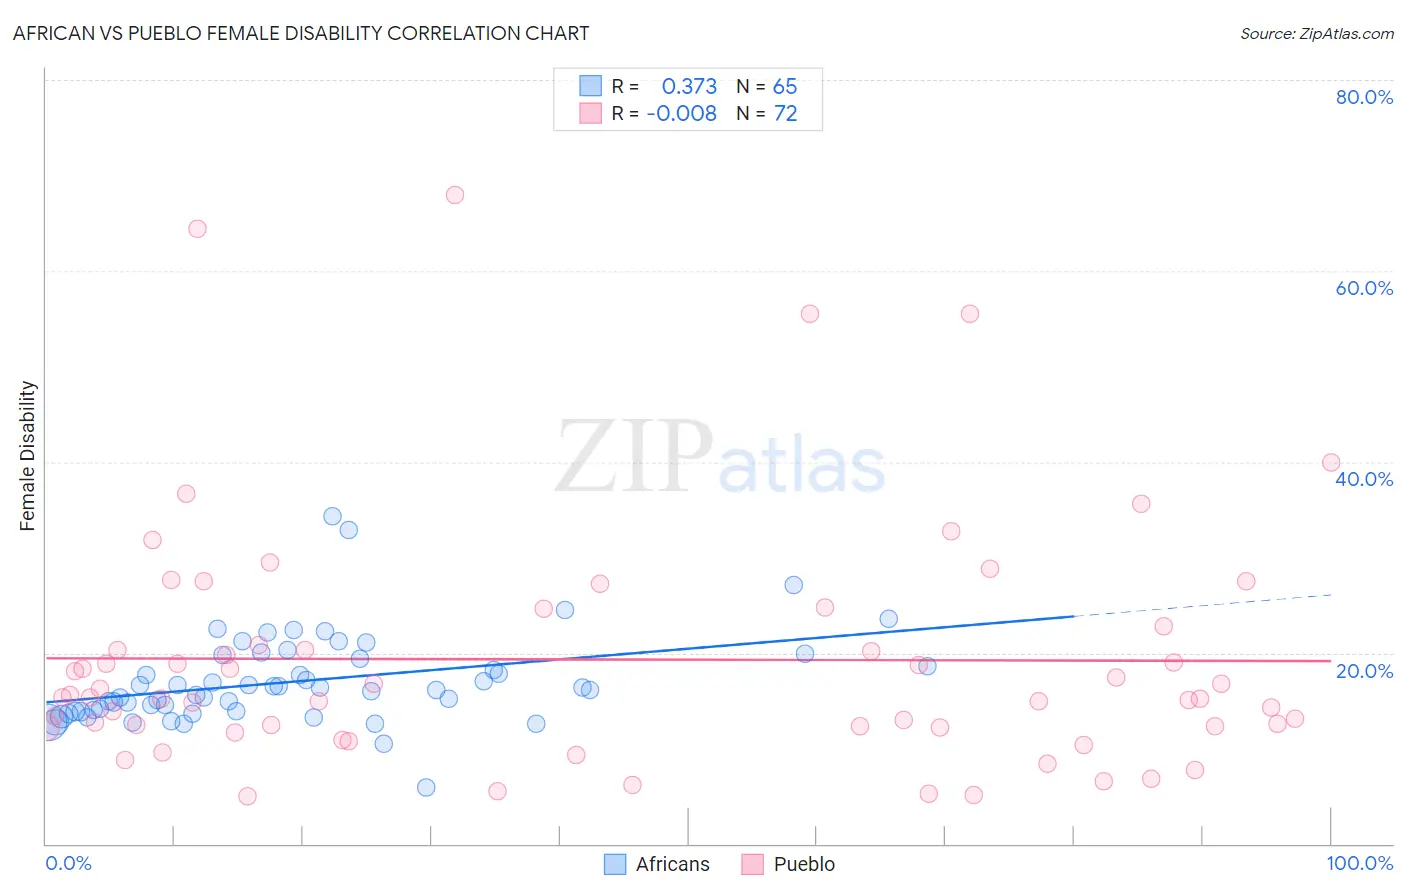
African vs Pueblo Female Disability Correlation Chart
The statistical analysis conducted on geographies consisting of 469,943,278 people shows a mild positive correlation between the proportion of Africans and percentage of females with a disability in the United States with a correlation coefficient (R) of 0.373 and weighted average of 13.4%. Similarly, the statistical analysis conducted on geographies consisting of 120,072,777 people shows no correlation between the proportion of Pueblo and percentage of females with a disability in the United States with a correlation coefficient (R) of -0.008 and weighted average of 14.1%, a difference of 5.1%.
Female Disability Correlation Summary
| Measurement | African | Pueblo |
| Minimum | 5.9% | 5.0% |
| Maximum | 34.2% | 67.9% |
| Range | 28.4% | 62.9% |
| Mean | 17.0% | 19.3% |
| Median | 16.1% | 15.4% |
| Interquartile 25% (IQ1) | 13.9% | 12.3% |
| Interquartile 75% (IQ3) | 19.5% | 21.8% |
| Interquartile Range (IQR) | 5.6% | 9.5% |
| Standard Deviation (Sample) | 4.7% | 12.9% |
| Standard Deviation (Population) | 4.7% | 12.8% |
Similar Demographics by Female Disability
Demographics Similar to Africans by Female Disability
In terms of female disability, the demographic groups most similar to Africans are Scotch-Irish (13.4%, a difference of 0.14%), Immigrants from Portugal (13.5%, a difference of 0.14%), Immigrants from Micronesia (13.5%, a difference of 0.17%), Pennsylvania German (13.4%, a difference of 0.20%), and Immigrants from Dominican Republic (13.4%, a difference of 0.21%).
| Demographics | Rating | Rank | Female Disability |
| Celtics | 0.0 /100 | #294 | Tragic 13.3% |
| French | 0.0 /100 | #295 | Tragic 13.3% |
| Nepalese | 0.0 /100 | #296 | Tragic 13.3% |
| Slovaks | 0.0 /100 | #297 | Tragic 13.3% |
| Immigrants | Nonimmigrants | 0.0 /100 | #298 | Tragic 13.4% |
| Immigrants | Dominican Republic | 0.0 /100 | #299 | Tragic 13.4% |
| Pennsylvania Germans | 0.0 /100 | #300 | Tragic 13.4% |
| Africans | 0.0 /100 | #301 | Tragic 13.4% |
| Scotch-Irish | 0.0 /100 | #302 | Tragic 13.4% |
| Immigrants | Portugal | 0.0 /100 | #303 | Tragic 13.5% |
| Immigrants | Micronesia | 0.0 /100 | #304 | Tragic 13.5% |
| Dominicans | 0.0 /100 | #305 | Tragic 13.5% |
| French Canadians | 0.0 /100 | #306 | Tragic 13.6% |
| Central American Indians | 0.0 /100 | #307 | Tragic 13.6% |
| Cree | 0.0 /100 | #308 | Tragic 13.7% |
Demographics Similar to Pueblo by Female Disability
In terms of female disability, the demographic groups most similar to Pueblo are Potawatomi (14.1%, a difference of 0.010%), American (14.1%, a difference of 0.15%), Black/African American (14.1%, a difference of 0.17%), Native/Alaskan (14.1%, a difference of 0.18%), and Navajo (14.2%, a difference of 0.32%).
| Demographics | Rating | Rank | Female Disability |
| Alaskan Athabascans | 0.0 /100 | #315 | Tragic 13.9% |
| Spanish Americans | 0.0 /100 | #316 | Tragic 14.0% |
| Chippewa | 0.0 /100 | #317 | Tragic 14.0% |
| Paiute | 0.0 /100 | #318 | Tragic 14.0% |
| Iroquois | 0.0 /100 | #319 | Tragic 14.0% |
| Americans | 0.0 /100 | #320 | Tragic 14.1% |
| Potawatomi | 0.0 /100 | #321 | Tragic 14.1% |
| Pueblo | 0.0 /100 | #322 | Tragic 14.1% |
| Blacks/African Americans | 0.0 /100 | #323 | Tragic 14.1% |
| Natives/Alaskans | 0.0 /100 | #324 | Tragic 14.1% |
| Navajo | 0.0 /100 | #325 | Tragic 14.2% |
| Comanche | 0.0 /100 | #326 | Tragic 14.2% |
| Ottawa | 0.0 /100 | #327 | Tragic 14.2% |
| Cape Verdeans | 0.0 /100 | #328 | Tragic 14.2% |
| Osage | 0.0 /100 | #329 | Tragic 14.3% |