Tlingit-Haida vs Central American Single Father Poverty
COMPARE
Tlingit-Haida
Central American
Single Father Poverty
Single Father Poverty Comparison
Tlingit-Haida
Central Americans
15.3%
SINGLE FATHER POVERTY
99.5/ 100
METRIC RATING
78th/ 347
METRIC RANK
16.0%
SINGLE FATHER POVERTY
87.1/ 100
METRIC RATING
138th/ 347
METRIC RANK
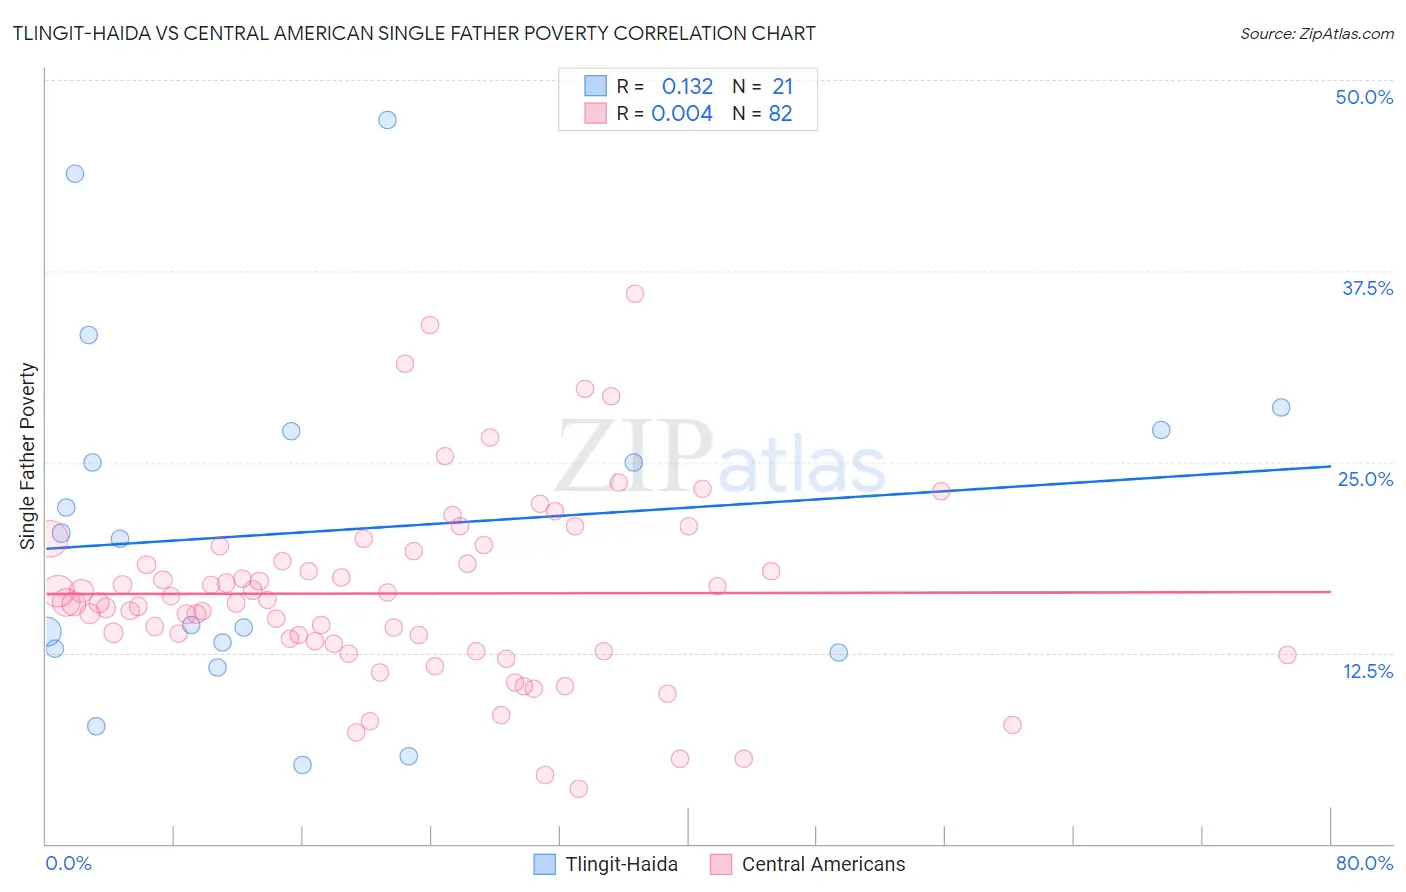
Tlingit-Haida vs Central American Single Father Poverty Correlation Chart
The statistical analysis conducted on geographies consisting of 55,978,156 people shows a poor positive correlation between the proportion of Tlingit-Haida and poverty level among single fathers in the United States with a correlation coefficient (R) of 0.132 and weighted average of 15.3%. Similarly, the statistical analysis conducted on geographies consisting of 382,583,767 people shows no correlation between the proportion of Central Americans and poverty level among single fathers in the United States with a correlation coefficient (R) of 0.004 and weighted average of 16.0%, a difference of 3.9%.
Single Father Poverty Correlation Summary
| Measurement | Tlingit-Haida | Central American |
| Minimum | 5.1% | 3.6% |
| Maximum | 47.4% | 36.0% |
| Range | 42.2% | 32.4% |
| Mean | 20.5% | 16.4% |
| Median | 20.0% | 15.8% |
| Interquartile 25% (IQ1) | 12.6% | 13.1% |
| Interquartile 75% (IQ3) | 27.1% | 19.1% |
| Interquartile Range (IQR) | 14.4% | 6.0% |
| Standard Deviation (Sample) | 11.5% | 6.1% |
| Standard Deviation (Population) | 11.2% | 6.1% |
Similar Demographics by Single Father Poverty
Demographics Similar to Tlingit-Haida by Single Father Poverty
In terms of single father poverty, the demographic groups most similar to Tlingit-Haida are Immigrants from Northern Africa (15.3%, a difference of 0.020%), Immigrants from Peru (15.3%, a difference of 0.050%), Immigrants from Japan (15.3%, a difference of 0.060%), Immigrants from Turkey (15.3%, a difference of 0.14%), and Maltese (15.3%, a difference of 0.16%).
| Demographics | Rating | Rank | Single Father Poverty |
| Immigrants | Brazil | 99.6 /100 | #71 | Exceptional 15.3% |
| Immigrants | Lithuania | 99.6 /100 | #72 | Exceptional 15.3% |
| Kenyans | 99.6 /100 | #73 | Exceptional 15.3% |
| Maltese | 99.6 /100 | #74 | Exceptional 15.3% |
| Immigrants | Turkey | 99.5 /100 | #75 | Exceptional 15.3% |
| Immigrants | Japan | 99.5 /100 | #76 | Exceptional 15.3% |
| Immigrants | Peru | 99.5 /100 | #77 | Exceptional 15.3% |
| Tlingit-Haida | 99.5 /100 | #78 | Exceptional 15.3% |
| Immigrants | Northern Africa | 99.5 /100 | #79 | Exceptional 15.3% |
| Armenians | 99.4 /100 | #80 | Exceptional 15.4% |
| Immigrants | Congo | 99.4 /100 | #81 | Exceptional 15.4% |
| Immigrants | Ukraine | 99.4 /100 | #82 | Exceptional 15.4% |
| Chinese | 99.3 /100 | #83 | Exceptional 15.4% |
| Peruvians | 99.2 /100 | #84 | Exceptional 15.4% |
| Immigrants | Oceania | 99.1 /100 | #85 | Exceptional 15.4% |
Demographics Similar to Central Americans by Single Father Poverty
In terms of single father poverty, the demographic groups most similar to Central Americans are Immigrants from the Azores (15.9%, a difference of 0.010%), Cypriot (15.9%, a difference of 0.040%), Immigrants from Sri Lanka (15.9%, a difference of 0.11%), South American (16.0%, a difference of 0.12%), and Immigrants from South America (15.9%, a difference of 0.14%).
| Demographics | Rating | Rank | Single Father Poverty |
| Nicaraguans | 90.1 /100 | #131 | Exceptional 15.9% |
| Immigrants | Portugal | 89.7 /100 | #132 | Excellent 15.9% |
| Immigrants | Syria | 89.5 /100 | #133 | Excellent 15.9% |
| Immigrants | South America | 88.5 /100 | #134 | Excellent 15.9% |
| Immigrants | Sri Lanka | 88.2 /100 | #135 | Excellent 15.9% |
| Cypriots | 87.5 /100 | #136 | Excellent 15.9% |
| Immigrants | Azores | 87.2 /100 | #137 | Excellent 15.9% |
| Central Americans | 87.1 /100 | #138 | Excellent 16.0% |
| South Americans | 85.9 /100 | #139 | Excellent 16.0% |
| Immigrants | Netherlands | 85.3 /100 | #140 | Excellent 16.0% |
| Liberians | 83.3 /100 | #141 | Excellent 16.0% |
| Immigrants | Mexico | 83.3 /100 | #142 | Excellent 16.0% |
| Immigrants | Central America | 83.1 /100 | #143 | Excellent 16.0% |
| Immigrants | Kuwait | 81.4 /100 | #144 | Excellent 16.0% |
| Immigrants | Western Asia | 80.7 /100 | #145 | Excellent 16.0% |