Immigrants from Burma/Myanmar vs Central American Disability Age Over 75
COMPARE
Immigrants from Burma/Myanmar
Central American
Disability Age Over 75
Disability Age Over 75 Comparison
Immigrants from Burma/Myanmar
Central Americans
47.9%
DISABILITY AGE OVER 75
11.7/ 100
METRIC RATING
212th/ 347
METRIC RANK
48.8%
DISABILITY AGE OVER 75
0.4/ 100
METRIC RATING
259th/ 347
METRIC RANK
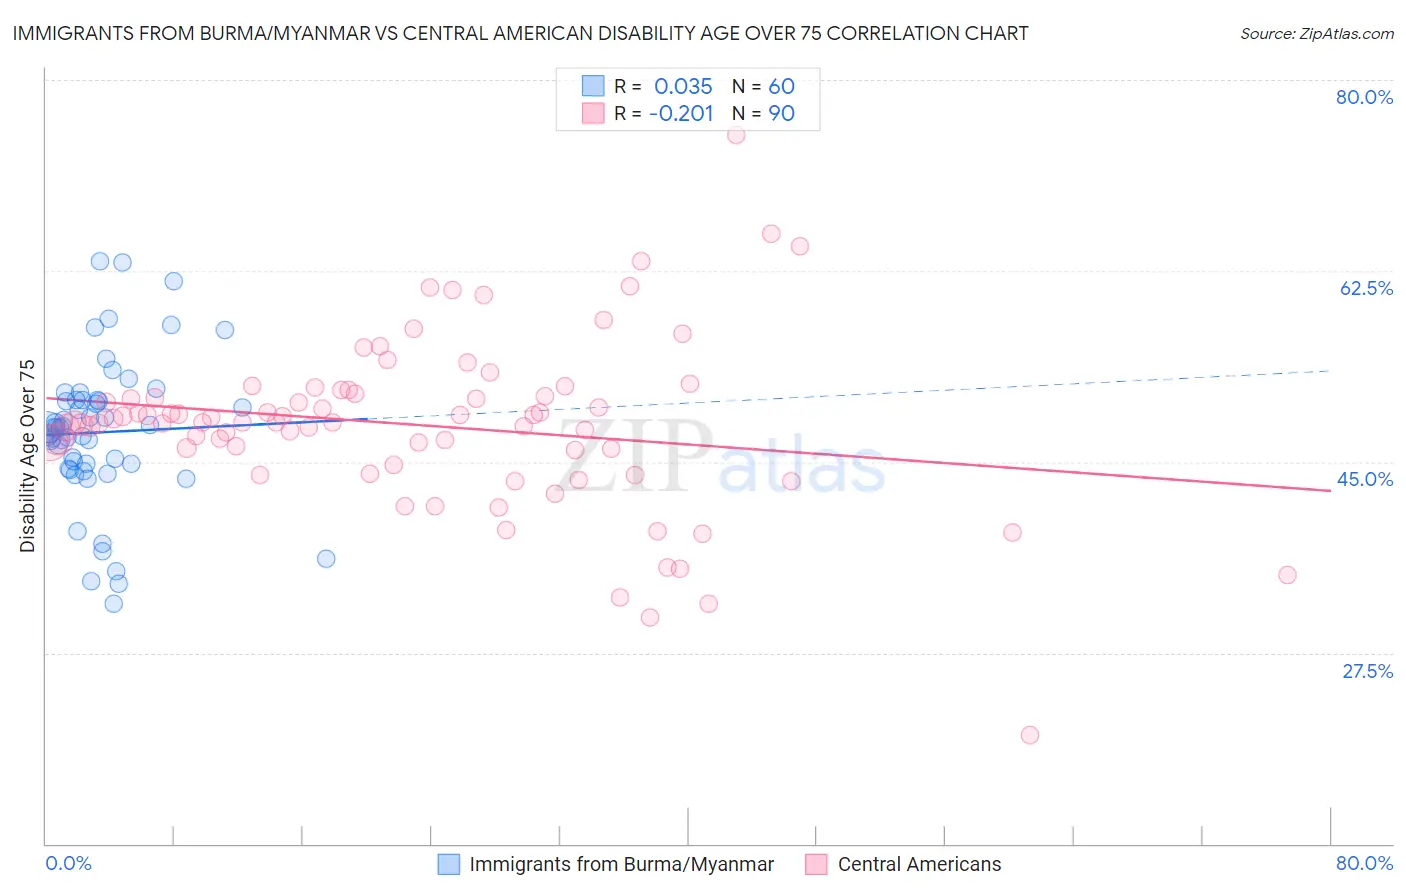
Immigrants from Burma/Myanmar vs Central American Disability Age Over 75 Correlation Chart
The statistical analysis conducted on geographies consisting of 172,144,400 people shows no correlation between the proportion of Immigrants from Burma/Myanmar and percentage of population with a disability over the age of 75 in the United States with a correlation coefficient (R) of 0.035 and weighted average of 47.9%. Similarly, the statistical analysis conducted on geographies consisting of 503,152,130 people shows a weak negative correlation between the proportion of Central Americans and percentage of population with a disability over the age of 75 in the United States with a correlation coefficient (R) of -0.201 and weighted average of 48.8%, a difference of 1.9%.
Disability Age Over 75 Correlation Summary
| Measurement | Immigrants from Burma/Myanmar | Central American |
| Minimum | 32.0% | 20.0% |
| Maximum | 63.4% | 75.0% |
| Range | 31.4% | 55.0% |
| Mean | 47.7% | 48.4% |
| Median | 48.1% | 48.6% |
| Interquartile 25% (IQ1) | 44.6% | 46.1% |
| Interquartile 75% (IQ3) | 50.7% | 51.3% |
| Interquartile Range (IQR) | 6.1% | 5.1% |
| Standard Deviation (Sample) | 6.7% | 8.0% |
| Standard Deviation (Population) | 6.6% | 7.9% |
Similar Demographics by Disability Age Over 75
Demographics Similar to Immigrants from Burma/Myanmar by Disability Age Over 75
In terms of disability age over 75, the demographic groups most similar to Immigrants from Burma/Myanmar are Panamanian (47.9%, a difference of 0.0%), Vietnamese (47.9%, a difference of 0.010%), Laotian (47.9%, a difference of 0.010%), Immigrants from Barbados (47.9%, a difference of 0.060%), and Senegalese (47.9%, a difference of 0.060%).
| Demographics | Rating | Rank | Disability Age Over 75 |
| Immigrants | Ghana | 19.1 /100 | #205 | Poor 47.7% |
| Jamaicans | 19.0 /100 | #206 | Poor 47.7% |
| Immigrants | Syria | 17.4 /100 | #207 | Poor 47.8% |
| Immigrants | Senegal | 16.9 /100 | #208 | Poor 47.8% |
| Immigrants | Indonesia | 14.2 /100 | #209 | Poor 47.8% |
| Vietnamese | 11.9 /100 | #210 | Poor 47.9% |
| Panamanians | 11.8 /100 | #211 | Poor 47.9% |
| Immigrants | Burma/Myanmar | 11.7 /100 | #212 | Poor 47.9% |
| Laotians | 11.5 /100 | #213 | Poor 47.9% |
| Immigrants | Barbados | 10.7 /100 | #214 | Poor 47.9% |
| Senegalese | 10.7 /100 | #215 | Poor 47.9% |
| Immigrants | Panama | 10.2 /100 | #216 | Poor 47.9% |
| Immigrants | Grenada | 9.4 /100 | #217 | Tragic 47.9% |
| Immigrants | Western Africa | 8.3 /100 | #218 | Tragic 48.0% |
| Immigrants | Western Asia | 7.5 /100 | #219 | Tragic 48.0% |
Demographics Similar to Central Americans by Disability Age Over 75
In terms of disability age over 75, the demographic groups most similar to Central Americans are Immigrants from Afghanistan (48.8%, a difference of 0.040%), Immigrants from Philippines (48.8%, a difference of 0.070%), African (48.9%, a difference of 0.10%), Blackfeet (48.8%, a difference of 0.11%), and Immigrants from West Indies (48.9%, a difference of 0.16%).
| Demographics | Rating | Rank | Disability Age Over 75 |
| Immigrants | South Eastern Asia | 0.7 /100 | #252 | Tragic 48.7% |
| British West Indians | 0.6 /100 | #253 | Tragic 48.7% |
| Immigrants | Vietnam | 0.6 /100 | #254 | Tragic 48.7% |
| Chinese | 0.5 /100 | #255 | Tragic 48.7% |
| Immigrants | Congo | 0.5 /100 | #256 | Tragic 48.7% |
| Blackfeet | 0.5 /100 | #257 | Tragic 48.8% |
| Immigrants | Philippines | 0.4 /100 | #258 | Tragic 48.8% |
| Central Americans | 0.4 /100 | #259 | Tragic 48.8% |
| Immigrants | Afghanistan | 0.4 /100 | #260 | Tragic 48.8% |
| Africans | 0.3 /100 | #261 | Tragic 48.9% |
| Immigrants | West Indies | 0.3 /100 | #262 | Tragic 48.9% |
| Salvadorans | 0.3 /100 | #263 | Tragic 48.9% |
| Immigrants | Honduras | 0.3 /100 | #264 | Tragic 48.9% |
| Hondurans | 0.3 /100 | #265 | Tragic 48.9% |
| U.S. Virgin Islanders | 0.2 /100 | #266 | Tragic 48.9% |