Subsaharan African vs Central American Disability Age Over 75
COMPARE
Subsaharan African
Central American
Disability Age Over 75
Disability Age Over 75 Comparison
Sub-Saharan Africans
Central Americans
48.2%
DISABILITY AGE OVER 75
3.8/ 100
METRIC RATING
234th/ 347
METRIC RANK
48.8%
DISABILITY AGE OVER 75
0.4/ 100
METRIC RATING
259th/ 347
METRIC RANK
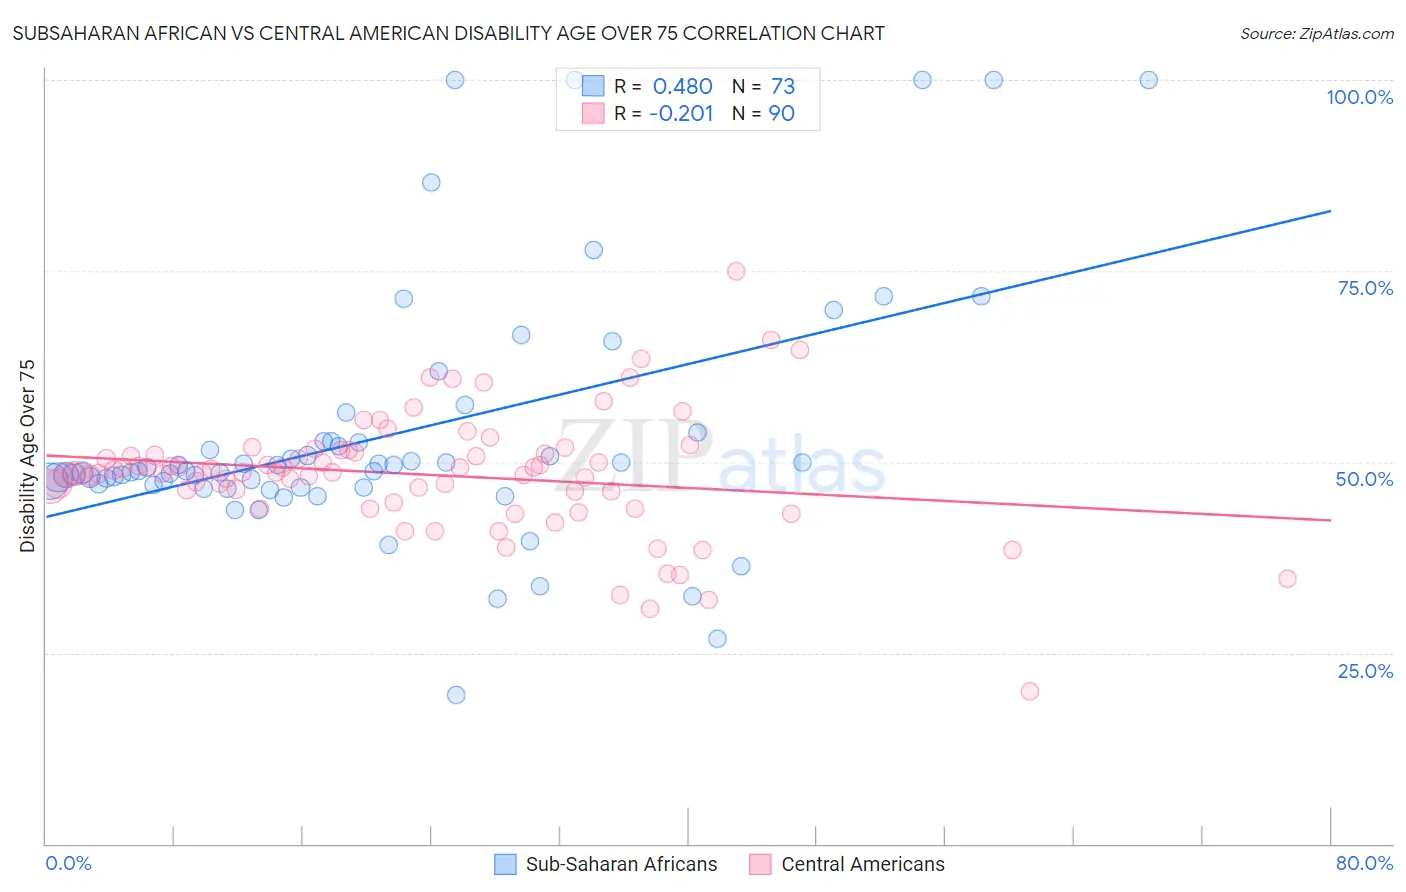
Subsaharan African vs Central American Disability Age Over 75 Correlation Chart
The statistical analysis conducted on geographies consisting of 506,598,024 people shows a moderate positive correlation between the proportion of Sub-Saharan Africans and percentage of population with a disability over the age of 75 in the United States with a correlation coefficient (R) of 0.480 and weighted average of 48.2%. Similarly, the statistical analysis conducted on geographies consisting of 503,152,130 people shows a weak negative correlation between the proportion of Central Americans and percentage of population with a disability over the age of 75 in the United States with a correlation coefficient (R) of -0.201 and weighted average of 48.8%, a difference of 1.3%.
Disability Age Over 75 Correlation Summary
| Measurement | Subsaharan African | Central American |
| Minimum | 19.4% | 20.0% |
| Maximum | 100.0% | 75.0% |
| Range | 80.6% | 55.0% |
| Mean | 53.4% | 48.4% |
| Median | 48.8% | 48.6% |
| Interquartile 25% (IQ1) | 46.9% | 46.1% |
| Interquartile 75% (IQ3) | 52.7% | 51.3% |
| Interquartile Range (IQR) | 5.8% | 5.1% |
| Standard Deviation (Sample) | 16.4% | 8.0% |
| Standard Deviation (Population) | 16.3% | 7.9% |
Similar Demographics by Disability Age Over 75
Demographics Similar to Sub-Saharan Africans by Disability Age Over 75
In terms of disability age over 75, the demographic groups most similar to Sub-Saharan Africans are Hmong (48.2%, a difference of 0.0%), Indonesian (48.2%, a difference of 0.060%), Cree (48.2%, a difference of 0.060%), Immigrants (48.2%, a difference of 0.080%), and Taiwanese (48.2%, a difference of 0.090%).
| Demographics | Rating | Rank | Disability Age Over 75 |
| Zimbabweans | 6.4 /100 | #227 | Tragic 48.1% |
| Immigrants | Liberia | 5.9 /100 | #228 | Tragic 48.1% |
| Spaniards | 5.7 /100 | #229 | Tragic 48.1% |
| Taiwanese | 4.4 /100 | #230 | Tragic 48.2% |
| Immigrants | Immigrants | 4.3 /100 | #231 | Tragic 48.2% |
| Indonesians | 4.2 /100 | #232 | Tragic 48.2% |
| Cree | 4.2 /100 | #233 | Tragic 48.2% |
| Sub-Saharan Africans | 3.8 /100 | #234 | Tragic 48.2% |
| Hmong | 3.8 /100 | #235 | Tragic 48.2% |
| Immigrants | Nicaragua | 3.2 /100 | #236 | Tragic 48.2% |
| Immigrants | St. Vincent and the Grenadines | 3.2 /100 | #237 | Tragic 48.2% |
| Nicaraguans | 3.0 /100 | #238 | Tragic 48.3% |
| Immigrants | Thailand | 2.8 /100 | #239 | Tragic 48.3% |
| Tongans | 2.3 /100 | #240 | Tragic 48.3% |
| Native Hawaiians | 2.2 /100 | #241 | Tragic 48.3% |
Demographics Similar to Central Americans by Disability Age Over 75
In terms of disability age over 75, the demographic groups most similar to Central Americans are Immigrants from Afghanistan (48.8%, a difference of 0.040%), Immigrants from Philippines (48.8%, a difference of 0.070%), African (48.9%, a difference of 0.10%), Blackfeet (48.8%, a difference of 0.11%), and Immigrants from West Indies (48.9%, a difference of 0.16%).
| Demographics | Rating | Rank | Disability Age Over 75 |
| Immigrants | South Eastern Asia | 0.7 /100 | #252 | Tragic 48.7% |
| British West Indians | 0.6 /100 | #253 | Tragic 48.7% |
| Immigrants | Vietnam | 0.6 /100 | #254 | Tragic 48.7% |
| Chinese | 0.5 /100 | #255 | Tragic 48.7% |
| Immigrants | Congo | 0.5 /100 | #256 | Tragic 48.7% |
| Blackfeet | 0.5 /100 | #257 | Tragic 48.8% |
| Immigrants | Philippines | 0.4 /100 | #258 | Tragic 48.8% |
| Central Americans | 0.4 /100 | #259 | Tragic 48.8% |
| Immigrants | Afghanistan | 0.4 /100 | #260 | Tragic 48.8% |
| Africans | 0.3 /100 | #261 | Tragic 48.9% |
| Immigrants | West Indies | 0.3 /100 | #262 | Tragic 48.9% |
| Salvadorans | 0.3 /100 | #263 | Tragic 48.9% |
| Immigrants | Honduras | 0.3 /100 | #264 | Tragic 48.9% |
| Hondurans | 0.3 /100 | #265 | Tragic 48.9% |
| U.S. Virgin Islanders | 0.2 /100 | #266 | Tragic 48.9% |