Hawaiian vs Central American Disability Age Over 75
COMPARE
Hawaiian
Central American
Disability Age Over 75
Disability Age Over 75 Comparison
Hawaiians
Central Americans
49.2%
DISABILITY AGE OVER 75
0.1/ 100
METRIC RATING
277th/ 347
METRIC RANK
48.8%
DISABILITY AGE OVER 75
0.4/ 100
METRIC RATING
259th/ 347
METRIC RANK
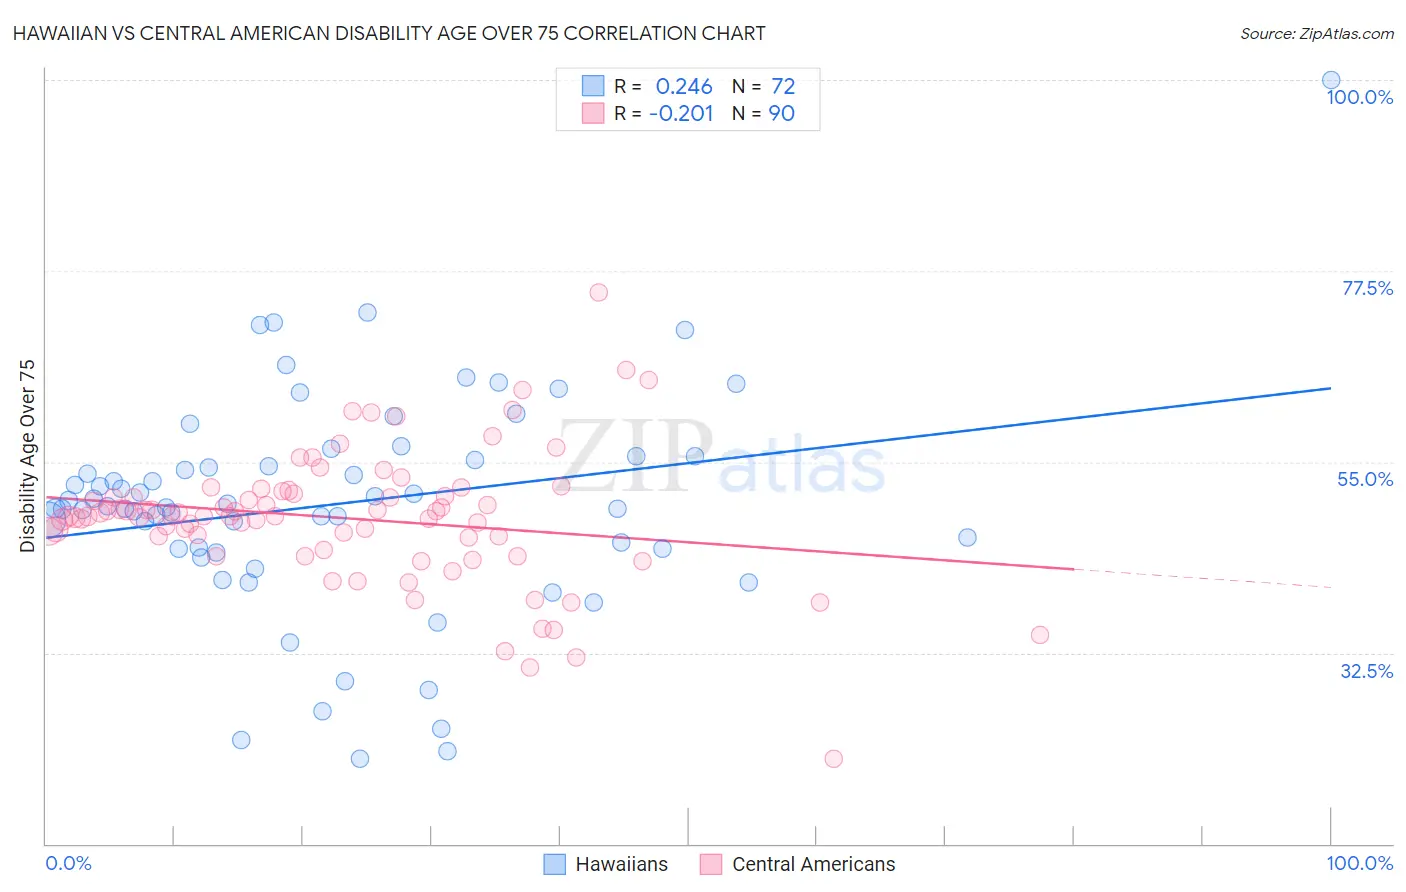
Hawaiian vs Central American Disability Age Over 75 Correlation Chart
The statistical analysis conducted on geographies consisting of 326,769,462 people shows a weak positive correlation between the proportion of Hawaiians and percentage of population with a disability over the age of 75 in the United States with a correlation coefficient (R) of 0.246 and weighted average of 49.2%. Similarly, the statistical analysis conducted on geographies consisting of 503,152,130 people shows a weak negative correlation between the proportion of Central Americans and percentage of population with a disability over the age of 75 in the United States with a correlation coefficient (R) of -0.201 and weighted average of 48.8%, a difference of 0.77%.
Disability Age Over 75 Correlation Summary
| Measurement | Hawaiian | Central American |
| Minimum | 20.0% | 20.0% |
| Maximum | 100.0% | 75.0% |
| Range | 80.0% | 55.0% |
| Mean | 50.0% | 48.4% |
| Median | 49.6% | 48.6% |
| Interquartile 25% (IQ1) | 44.8% | 46.1% |
| Interquartile 75% (IQ3) | 55.5% | 51.3% |
| Interquartile Range (IQR) | 10.7% | 5.1% |
| Standard Deviation (Sample) | 13.1% | 8.0% |
| Standard Deviation (Population) | 13.0% | 7.9% |
Demographics Similar to Hawaiians and Central Americans by Disability Age Over 75
In terms of disability age over 75, the demographic groups most similar to Hawaiians are Immigrants from Uzbekistan (49.2%, a difference of 0.020%), Immigrants from Laos (49.2%, a difference of 0.030%), Immigrants from Dominica (49.1%, a difference of 0.14%), Immigrants from Guatemala (49.1%, a difference of 0.15%), and Immigrants from Iraq (49.1%, a difference of 0.22%). Similarly, the demographic groups most similar to Central Americans are Immigrants from Afghanistan (48.8%, a difference of 0.040%), Immigrants from Philippines (48.8%, a difference of 0.070%), African (48.9%, a difference of 0.10%), Immigrants from West Indies (48.9%, a difference of 0.16%), and Salvadoran (48.9%, a difference of 0.17%).
| Demographics | Rating | Rank | Disability Age Over 75 |
| Immigrants | Philippines | 0.4 /100 | #258 | Tragic 48.8% |
| Central Americans | 0.4 /100 | #259 | Tragic 48.8% |
| Immigrants | Afghanistan | 0.4 /100 | #260 | Tragic 48.8% |
| Africans | 0.3 /100 | #261 | Tragic 48.9% |
| Immigrants | West Indies | 0.3 /100 | #262 | Tragic 48.9% |
| Salvadorans | 0.3 /100 | #263 | Tragic 48.9% |
| Immigrants | Honduras | 0.3 /100 | #264 | Tragic 48.9% |
| Hondurans | 0.3 /100 | #265 | Tragic 48.9% |
| U.S. Virgin Islanders | 0.2 /100 | #266 | Tragic 48.9% |
| Malaysians | 0.2 /100 | #267 | Tragic 49.0% |
| Guatemalans | 0.2 /100 | #268 | Tragic 49.0% |
| Immigrants | El Salvador | 0.2 /100 | #269 | Tragic 49.0% |
| Potawatomi | 0.2 /100 | #270 | Tragic 49.0% |
| Fijians | 0.2 /100 | #271 | Tragic 49.0% |
| Assyrians/Chaldeans/Syriacs | 0.2 /100 | #272 | Tragic 49.1% |
| Immigrants | Iraq | 0.1 /100 | #273 | Tragic 49.1% |
| Immigrants | Guatemala | 0.1 /100 | #274 | Tragic 49.1% |
| Immigrants | Dominica | 0.1 /100 | #275 | Tragic 49.1% |
| Immigrants | Uzbekistan | 0.1 /100 | #276 | Tragic 49.2% |
| Hawaiians | 0.1 /100 | #277 | Tragic 49.2% |
| Immigrants | Laos | 0.1 /100 | #278 | Tragic 49.2% |