Tlingit-Haida vs Central American Disability Age 18 to 34
COMPARE
Tlingit-Haida
Central American
Disability Age 18 to 34
Disability Age 18 to 34 Comparison
Tlingit-Haida
Central Americans
7.7%
DISABILITY AGE 18 TO 34
0.0/ 100
METRIC RATING
295th/ 347
METRIC RANK
6.2%
DISABILITY AGE 18 TO 34
97.5/ 100
METRIC RATING
95th/ 347
METRIC RANK
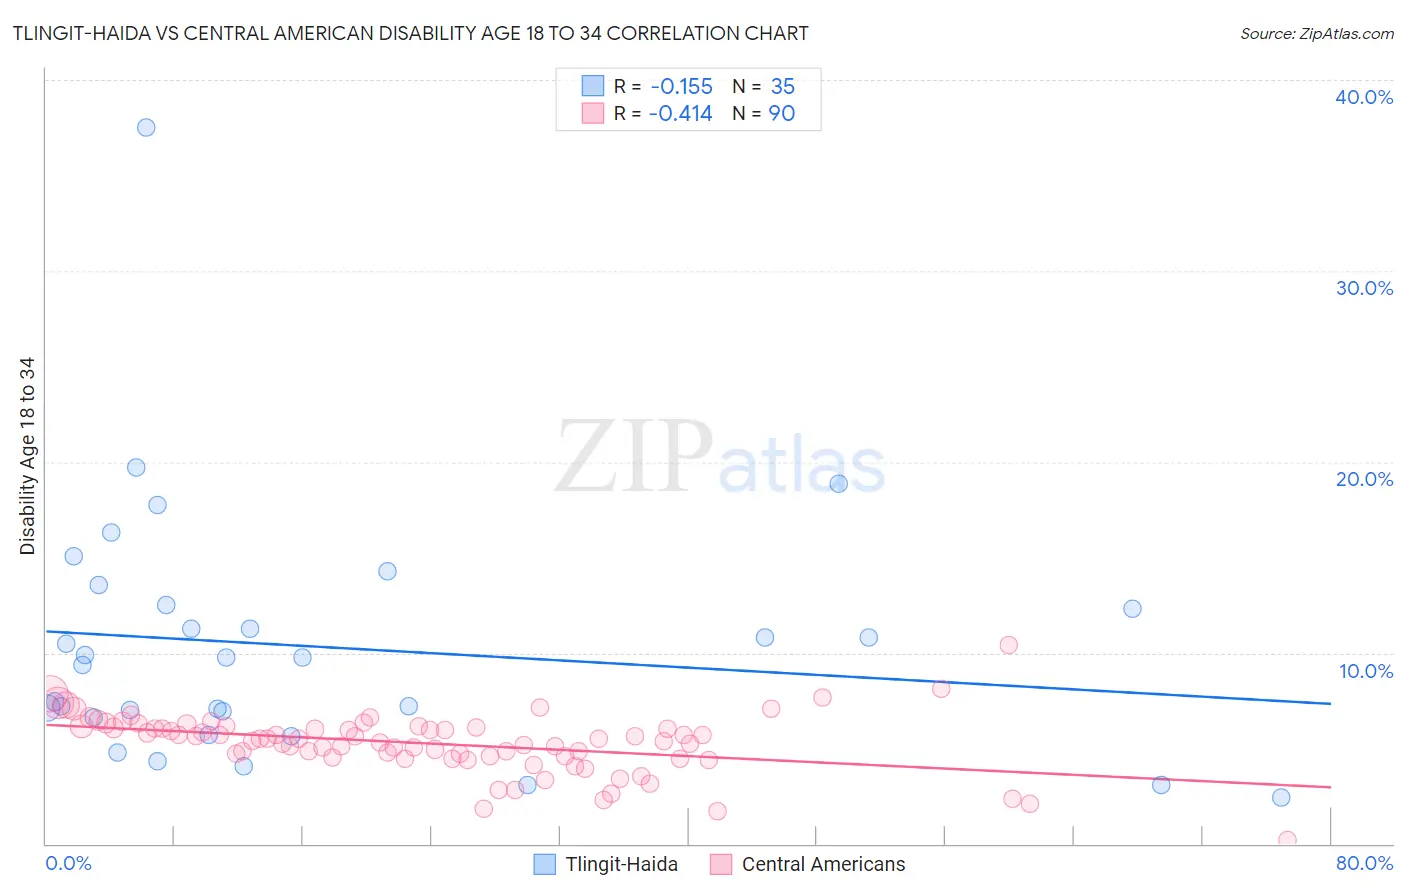
Tlingit-Haida vs Central American Disability Age 18 to 34 Correlation Chart
The statistical analysis conducted on geographies consisting of 60,778,142 people shows a poor negative correlation between the proportion of Tlingit-Haida and percentage of population with a disability between the ages 18 and 35 in the United States with a correlation coefficient (R) of -0.155 and weighted average of 7.7%. Similarly, the statistical analysis conducted on geographies consisting of 502,711,138 people shows a moderate negative correlation between the proportion of Central Americans and percentage of population with a disability between the ages 18 and 35 in the United States with a correlation coefficient (R) of -0.414 and weighted average of 6.2%, a difference of 24.4%.
Disability Age 18 to 34 Correlation Summary
| Measurement | Tlingit-Haida | Central American |
| Minimum | 2.4% | 0.22% |
| Maximum | 37.5% | 10.4% |
| Range | 35.1% | 10.2% |
| Mean | 10.3% | 5.3% |
| Median | 9.7% | 5.5% |
| Interquartile 25% (IQ1) | 6.6% | 4.6% |
| Interquartile 75% (IQ3) | 12.5% | 6.1% |
| Interquartile Range (IQR) | 5.9% | 1.5% |
| Standard Deviation (Sample) | 6.5% | 1.5% |
| Standard Deviation (Population) | 6.4% | 1.5% |
Similar Demographics by Disability Age 18 to 34
Demographics Similar to Tlingit-Haida by Disability Age 18 to 34
In terms of disability age 18 to 34, the demographic groups most similar to Tlingit-Haida are Immigrants from Cabo Verde (7.7%, a difference of 0.010%), Scandinavian (7.7%, a difference of 0.16%), Cape Verdean (7.7%, a difference of 0.18%), Pueblo (7.7%, a difference of 0.19%), and Black/African American (7.7%, a difference of 0.22%).
| Demographics | Rating | Rank | Disability Age 18 to 34 |
| Whites/Caucasians | 0.0 /100 | #288 | Tragic 7.6% |
| Immigrants | Nonimmigrants | 0.0 /100 | #289 | Tragic 7.6% |
| Slovaks | 0.0 /100 | #290 | Tragic 7.7% |
| Irish | 0.0 /100 | #291 | Tragic 7.7% |
| Blacks/African Americans | 0.0 /100 | #292 | Tragic 7.7% |
| Scandinavians | 0.0 /100 | #293 | Tragic 7.7% |
| Immigrants | Cabo Verde | 0.0 /100 | #294 | Tragic 7.7% |
| Tlingit-Haida | 0.0 /100 | #295 | Tragic 7.7% |
| Cape Verdeans | 0.0 /100 | #296 | Tragic 7.7% |
| Pueblo | 0.0 /100 | #297 | Tragic 7.7% |
| Dutch | 0.0 /100 | #298 | Tragic 7.7% |
| Germans | 0.0 /100 | #299 | Tragic 7.7% |
| Scottish | 0.0 /100 | #300 | Tragic 7.7% |
| Pima | 0.0 /100 | #301 | Tragic 7.7% |
| Welsh | 0.0 /100 | #302 | Tragic 7.7% |
Demographics Similar to Central Americans by Disability Age 18 to 34
In terms of disability age 18 to 34, the demographic groups most similar to Central Americans are Immigrants from Kazakhstan (6.2%, a difference of 0.030%), Immigrants from Uruguay (6.2%, a difference of 0.050%), Immigrants (6.2%, a difference of 0.080%), Jordanian (6.2%, a difference of 0.10%), and Uruguayan (6.2%, a difference of 0.13%).
| Demographics | Rating | Rank | Disability Age 18 to 34 |
| Cambodians | 97.8 /100 | #88 | Exceptional 6.2% |
| Turks | 97.8 /100 | #89 | Exceptional 6.2% |
| Immigrants | Vietnam | 97.7 /100 | #90 | Exceptional 6.2% |
| Immigrants | Philippines | 97.6 /100 | #91 | Exceptional 6.2% |
| Jordanians | 97.6 /100 | #92 | Exceptional 6.2% |
| Immigrants | Immigrants | 97.6 /100 | #93 | Exceptional 6.2% |
| Immigrants | Kazakhstan | 97.5 /100 | #94 | Exceptional 6.2% |
| Central Americans | 97.5 /100 | #95 | Exceptional 6.2% |
| Immigrants | Uruguay | 97.4 /100 | #96 | Exceptional 6.2% |
| Uruguayans | 97.3 /100 | #97 | Exceptional 6.2% |
| Immigrants | Syria | 97.2 /100 | #98 | Exceptional 6.2% |
| Immigrants | Ethiopia | 96.9 /100 | #99 | Exceptional 6.2% |
| Immigrants | Albania | 96.7 /100 | #100 | Exceptional 6.2% |
| Immigrants | Jamaica | 96.4 /100 | #101 | Exceptional 6.2% |
| Laotians | 96.4 /100 | #102 | Exceptional 6.2% |