Chippewa vs Chickasaw Hearing Disability
COMPARE
Chippewa
Chickasaw
Hearing Disability
Hearing Disability Comparison
Chippewa
Chickasaw
4.0%
HEARING DISABILITY
0.0/ 100
METRIC RATING
319th/ 347
METRIC RANK
4.5%
HEARING DISABILITY
0.0/ 100
METRIC RATING
337th/ 347
METRIC RANK
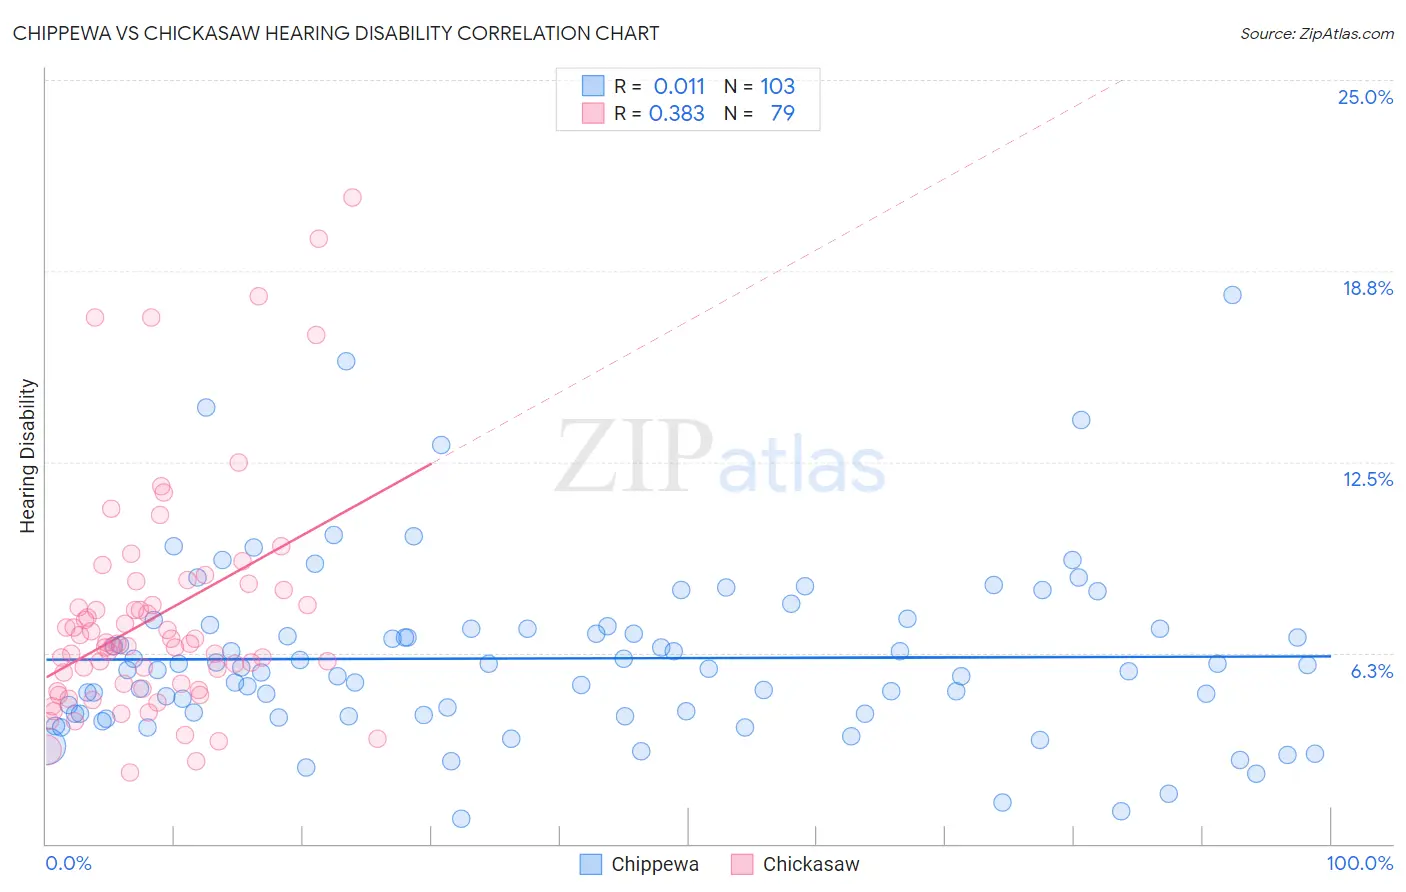
Chippewa vs Chickasaw Hearing Disability Correlation Chart
The statistical analysis conducted on geographies consisting of 215,037,759 people shows no correlation between the proportion of Chippewa and percentage of population with hearing disability in the United States with a correlation coefficient (R) of 0.011 and weighted average of 4.0%. Similarly, the statistical analysis conducted on geographies consisting of 147,680,195 people shows a mild positive correlation between the proportion of Chickasaw and percentage of population with hearing disability in the United States with a correlation coefficient (R) of 0.383 and weighted average of 4.5%, a difference of 12.1%.
Hearing Disability Correlation Summary
| Measurement | Chippewa | Chickasaw |
| Minimum | 0.81% | 2.3% |
| Maximum | 17.9% | 21.2% |
| Range | 17.1% | 18.8% |
| Mean | 6.1% | 7.4% |
| Median | 5.7% | 6.5% |
| Interquartile 25% (IQ1) | 4.2% | 5.1% |
| Interquartile 75% (IQ3) | 7.0% | 8.3% |
| Interquartile Range (IQR) | 2.8% | 3.2% |
| Standard Deviation (Sample) | 2.9% | 3.8% |
| Standard Deviation (Population) | 2.9% | 3.8% |
Demographics Similar to Chippewa and Chickasaw by Hearing Disability
In terms of hearing disability, the demographic groups most similar to Chippewa are Cheyenne (4.0%, a difference of 0.65%), Shoshone (4.0%, a difference of 0.81%), Paiute (4.1%, a difference of 2.1%), Seminole (4.1%, a difference of 2.3%), and Apache (4.1%, a difference of 2.5%). Similarly, the demographic groups most similar to Chickasaw are Alaska Native (4.5%, a difference of 0.21%), Creek (4.4%, a difference of 2.5%), Kiowa (4.3%, a difference of 3.2%), Aleut (4.3%, a difference of 4.6%), and Dutch West Indian (4.3%, a difference of 5.1%).
| Demographics | Rating | Rank | Hearing Disability |
| Cheyenne | 0.0 /100 | #318 | Tragic 4.0% |
| Chippewa | 0.0 /100 | #319 | Tragic 4.0% |
| Shoshone | 0.0 /100 | #320 | Tragic 4.0% |
| Paiute | 0.0 /100 | #321 | Tragic 4.1% |
| Seminole | 0.0 /100 | #322 | Tragic 4.1% |
| Apache | 0.0 /100 | #323 | Tragic 4.1% |
| Osage | 0.0 /100 | #324 | Tragic 4.1% |
| Lumbee | 0.0 /100 | #325 | Tragic 4.1% |
| Potawatomi | 0.0 /100 | #326 | Tragic 4.1% |
| Arapaho | 0.0 /100 | #327 | Tragic 4.1% |
| Tohono O'odham | 0.0 /100 | #328 | Tragic 4.2% |
| Crow | 0.0 /100 | #329 | Tragic 4.2% |
| Natives/Alaskans | 0.0 /100 | #330 | Tragic 4.2% |
| Cherokee | 0.0 /100 | #331 | Tragic 4.2% |
| Houma | 0.0 /100 | #332 | Tragic 4.2% |
| Dutch West Indians | 0.0 /100 | #333 | Tragic 4.3% |
| Aleuts | 0.0 /100 | #334 | Tragic 4.3% |
| Kiowa | 0.0 /100 | #335 | Tragic 4.3% |
| Creek | 0.0 /100 | #336 | Tragic 4.4% |
| Chickasaw | 0.0 /100 | #337 | Tragic 4.5% |
| Alaska Natives | 0.0 /100 | #338 | Tragic 4.5% |