Chippewa vs Estonian Hearing Disability
COMPARE
Chippewa
Estonian
Hearing Disability
Hearing Disability Comparison
Chippewa
Estonians
4.0%
HEARING DISABILITY
0.0/ 100
METRIC RATING
319th/ 347
METRIC RANK
3.3%
HEARING DISABILITY
2.4/ 100
METRIC RATING
233rd/ 347
METRIC RANK
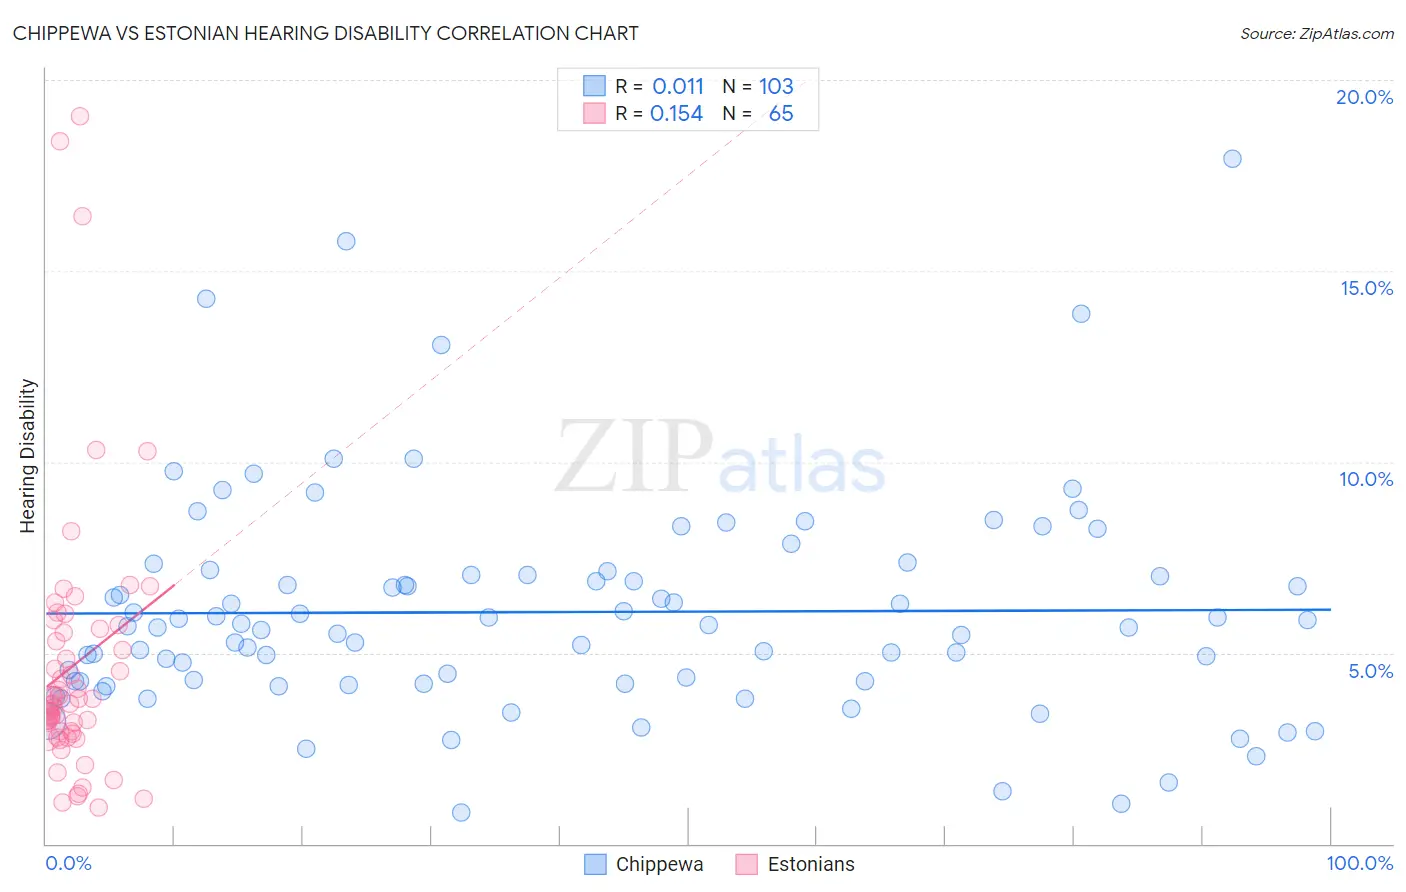
Chippewa vs Estonian Hearing Disability Correlation Chart
The statistical analysis conducted on geographies consisting of 215,037,759 people shows no correlation between the proportion of Chippewa and percentage of population with hearing disability in the United States with a correlation coefficient (R) of 0.011 and weighted average of 4.0%. Similarly, the statistical analysis conducted on geographies consisting of 123,522,478 people shows a poor positive correlation between the proportion of Estonians and percentage of population with hearing disability in the United States with a correlation coefficient (R) of 0.154 and weighted average of 3.3%, a difference of 22.7%.
Hearing Disability Correlation Summary
| Measurement | Chippewa | Estonian |
| Minimum | 0.81% | 0.96% |
| Maximum | 17.9% | 19.0% |
| Range | 17.1% | 18.1% |
| Mean | 6.1% | 4.7% |
| Median | 5.7% | 3.7% |
| Interquartile 25% (IQ1) | 4.2% | 2.9% |
| Interquartile 75% (IQ3) | 7.0% | 5.6% |
| Interquartile Range (IQR) | 2.8% | 2.7% |
| Standard Deviation (Sample) | 2.9% | 3.5% |
| Standard Deviation (Population) | 2.9% | 3.5% |
Similar Demographics by Hearing Disability
Demographics Similar to Chippewa by Hearing Disability
In terms of hearing disability, the demographic groups most similar to Chippewa are Cheyenne (4.0%, a difference of 0.65%), Shoshone (4.0%, a difference of 0.81%), Comanche (4.0%, a difference of 0.82%), Spanish American (4.0%, a difference of 0.95%), and Puget Sound Salish (3.9%, a difference of 1.1%).
| Demographics | Rating | Rank | Hearing Disability |
| Cajuns | 0.0 /100 | #312 | Tragic 3.9% |
| Hopi | 0.0 /100 | #313 | Tragic 3.9% |
| Yakama | 0.0 /100 | #314 | Tragic 3.9% |
| Puget Sound Salish | 0.0 /100 | #315 | Tragic 3.9% |
| Spanish Americans | 0.0 /100 | #316 | Tragic 4.0% |
| Comanche | 0.0 /100 | #317 | Tragic 4.0% |
| Cheyenne | 0.0 /100 | #318 | Tragic 4.0% |
| Chippewa | 0.0 /100 | #319 | Tragic 4.0% |
| Shoshone | 0.0 /100 | #320 | Tragic 4.0% |
| Paiute | 0.0 /100 | #321 | Tragic 4.1% |
| Seminole | 0.0 /100 | #322 | Tragic 4.1% |
| Apache | 0.0 /100 | #323 | Tragic 4.1% |
| Osage | 0.0 /100 | #324 | Tragic 4.1% |
| Lumbee | 0.0 /100 | #325 | Tragic 4.1% |
| Potawatomi | 0.0 /100 | #326 | Tragic 4.1% |
Demographics Similar to Estonians by Hearing Disability
In terms of hearing disability, the demographic groups most similar to Estonians are Central American Indian (3.3%, a difference of 0.070%), Guamanian/Chamorro (3.3%, a difference of 0.17%), Serbian (3.3%, a difference of 0.24%), Ukrainian (3.2%, a difference of 0.37%), and Luxembourger (3.2%, a difference of 0.42%).
| Demographics | Rating | Rank | Hearing Disability |
| Lebanese | 5.0 /100 | #226 | Tragic 3.2% |
| Bhutanese | 4.6 /100 | #227 | Tragic 3.2% |
| Immigrants | Portugal | 4.3 /100 | #228 | Tragic 3.2% |
| Maltese | 4.1 /100 | #229 | Tragic 3.2% |
| Greeks | 3.2 /100 | #230 | Tragic 3.2% |
| Luxembourgers | 2.9 /100 | #231 | Tragic 3.2% |
| Ukrainians | 2.9 /100 | #232 | Tragic 3.2% |
| Estonians | 2.4 /100 | #233 | Tragic 3.3% |
| Central American Indians | 2.3 /100 | #234 | Tragic 3.3% |
| Guamanians/Chamorros | 2.2 /100 | #235 | Tragic 3.3% |
| Serbians | 2.2 /100 | #236 | Tragic 3.3% |
| Immigrants | Austria | 1.8 /100 | #237 | Tragic 3.3% |
| German Russians | 1.8 /100 | #238 | Tragic 3.3% |
| Nepalese | 1.2 /100 | #239 | Tragic 3.3% |
| Immigrants | Netherlands | 1.1 /100 | #240 | Tragic 3.3% |