Chippewa vs Chickasaw Disability Age 65 to 74
COMPARE
Chippewa
Chickasaw
Disability Age 65 to 74
Disability Age 65 to 74 Comparison
Chippewa
Chickasaw
27.8%
DISABILITY AGE 65 TO 74
0.0/ 100
METRIC RATING
314th/ 347
METRIC RANK
30.2%
DISABILITY AGE 65 TO 74
0.0/ 100
METRIC RATING
331st/ 347
METRIC RANK
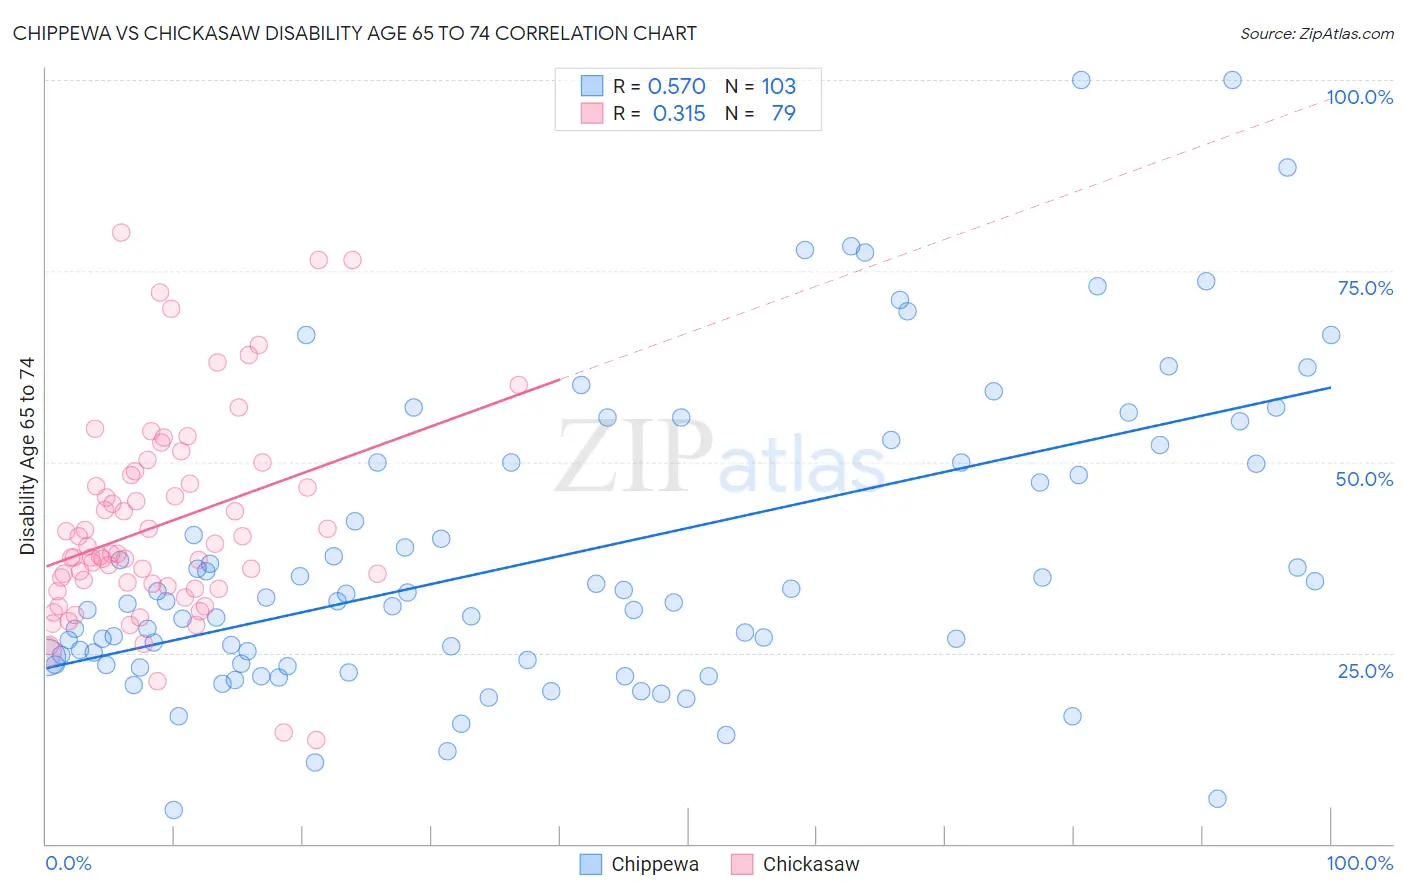
Chippewa vs Chickasaw Disability Age 65 to 74 Correlation Chart
The statistical analysis conducted on geographies consisting of 214,741,150 people shows a substantial positive correlation between the proportion of Chippewa and percentage of population with a disability between the ages 65 and 75 in the United States with a correlation coefficient (R) of 0.570 and weighted average of 27.8%. Similarly, the statistical analysis conducted on geographies consisting of 147,556,011 people shows a mild positive correlation between the proportion of Chickasaw and percentage of population with a disability between the ages 65 and 75 in the United States with a correlation coefficient (R) of 0.315 and weighted average of 30.2%, a difference of 8.7%.
Disability Age 65 to 74 Correlation Summary
| Measurement | Chippewa | Chickasaw |
| Minimum | 4.3% | 13.6% |
| Maximum | 100.0% | 80.0% |
| Range | 95.7% | 66.4% |
| Mean | 37.7% | 41.7% |
| Median | 31.7% | 38.0% |
| Interquartile 25% (IQ1) | 23.6% | 33.3% |
| Interquartile 75% (IQ3) | 50.0% | 48.3% |
| Interquartile Range (IQR) | 26.4% | 14.9% |
| Standard Deviation (Sample) | 19.8% | 13.4% |
| Standard Deviation (Population) | 19.8% | 13.3% |
Demographics Similar to Chippewa and Chickasaw by Disability Age 65 to 74
In terms of disability age 65 to 74, the demographic groups most similar to Chippewa are Paiute (27.8%, a difference of 0.010%), Cajun (27.9%, a difference of 0.47%), Crow (27.9%, a difference of 0.52%), Immigrants from Armenia (28.0%, a difference of 0.60%), and Nepalese (28.0%, a difference of 0.83%). Similarly, the demographic groups most similar to Chickasaw are Creek (30.2%, a difference of 0.010%), Choctaw (30.2%, a difference of 0.040%), Native/Alaskan (30.4%, a difference of 0.62%), Hopi (30.0%, a difference of 0.84%), and Apache (29.7%, a difference of 1.8%).
| Demographics | Rating | Rank | Disability Age 65 to 74 |
| Osage | 0.0 /100 | #312 | Tragic 27.5% |
| Paiute | 0.0 /100 | #313 | Tragic 27.8% |
| Chippewa | 0.0 /100 | #314 | Tragic 27.8% |
| Cajuns | 0.0 /100 | #315 | Tragic 27.9% |
| Crow | 0.0 /100 | #316 | Tragic 27.9% |
| Immigrants | Armenia | 0.0 /100 | #317 | Tragic 28.0% |
| Nepalese | 0.0 /100 | #318 | Tragic 28.0% |
| Arapaho | 0.0 /100 | #319 | Tragic 28.1% |
| Cherokee | 0.0 /100 | #320 | Tragic 28.2% |
| Comanche | 0.0 /100 | #321 | Tragic 28.3% |
| Aleuts | 0.0 /100 | #322 | Tragic 28.4% |
| Puerto Ricans | 0.0 /100 | #323 | Tragic 29.1% |
| Seminole | 0.0 /100 | #324 | Tragic 29.4% |
| Dutch West Indians | 0.0 /100 | #325 | Tragic 29.6% |
| Yakama | 0.0 /100 | #326 | Tragic 29.6% |
| Apache | 0.0 /100 | #327 | Tragic 29.7% |
| Hopi | 0.0 /100 | #328 | Tragic 30.0% |
| Choctaw | 0.0 /100 | #329 | Tragic 30.2% |
| Creek | 0.0 /100 | #330 | Tragic 30.2% |
| Chickasaw | 0.0 /100 | #331 | Tragic 30.2% |
| Natives/Alaskans | 0.0 /100 | #332 | Tragic 30.4% |