Chippewa vs Kiowa Hearing Disability
COMPARE
Chippewa
Kiowa
Hearing Disability
Hearing Disability Comparison
Chippewa
Kiowa
4.0%
HEARING DISABILITY
0.0/ 100
METRIC RATING
319th/ 347
METRIC RANK
4.3%
HEARING DISABILITY
0.0/ 100
METRIC RATING
335th/ 347
METRIC RANK
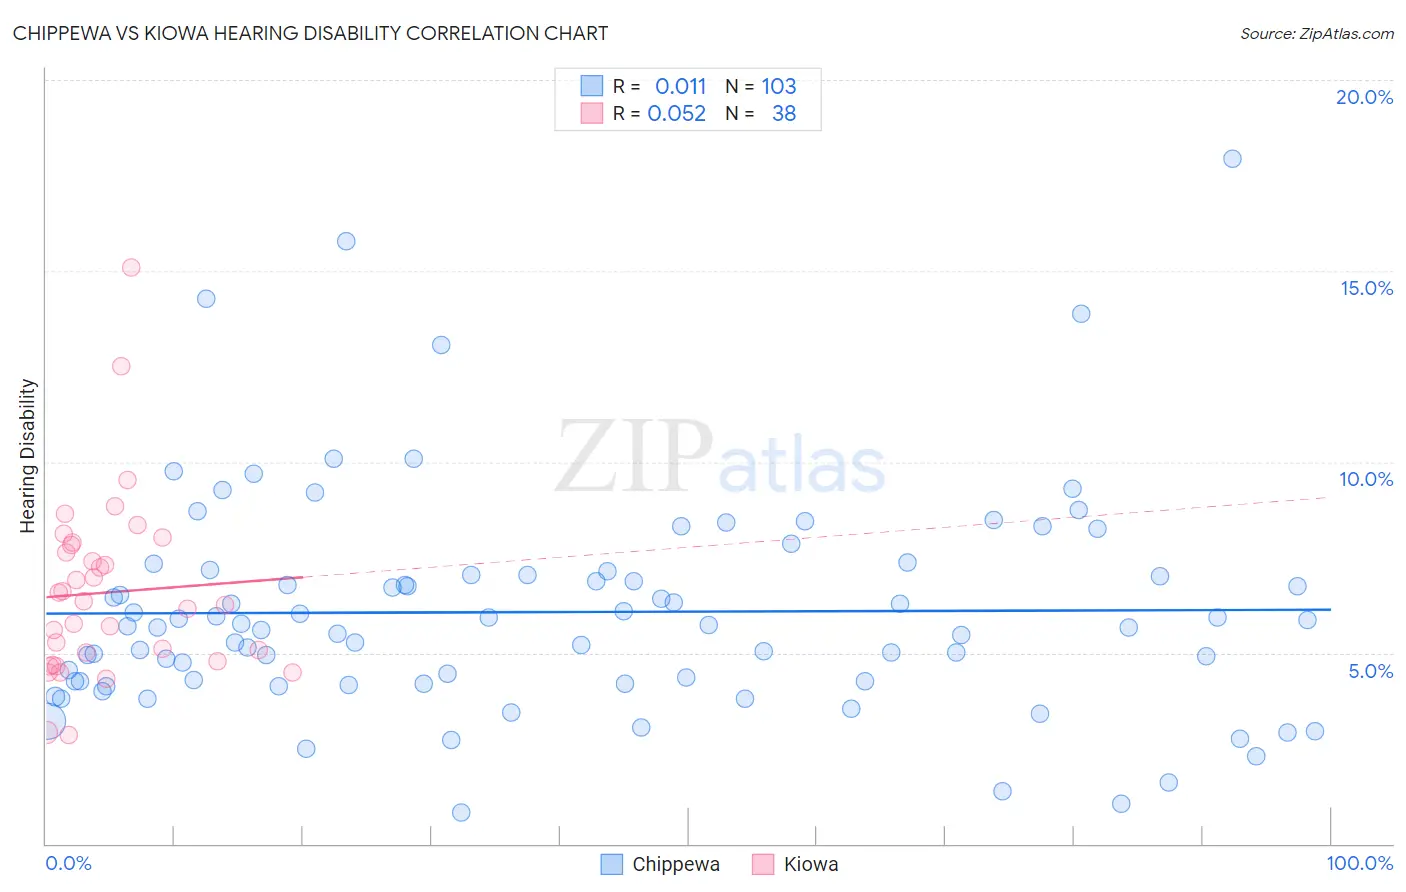
Chippewa vs Kiowa Hearing Disability Correlation Chart
The statistical analysis conducted on geographies consisting of 215,037,759 people shows no correlation between the proportion of Chippewa and percentage of population with hearing disability in the United States with a correlation coefficient (R) of 0.011 and weighted average of 4.0%. Similarly, the statistical analysis conducted on geographies consisting of 56,096,605 people shows a slight positive correlation between the proportion of Kiowa and percentage of population with hearing disability in the United States with a correlation coefficient (R) of 0.052 and weighted average of 4.3%, a difference of 8.6%.
Hearing Disability Correlation Summary
| Measurement | Chippewa | Kiowa |
| Minimum | 0.81% | 2.8% |
| Maximum | 17.9% | 15.1% |
| Range | 17.1% | 12.2% |
| Mean | 6.1% | 6.6% |
| Median | 5.7% | 6.3% |
| Interquartile 25% (IQ1) | 4.2% | 4.8% |
| Interquartile 75% (IQ3) | 7.0% | 7.8% |
| Interquartile Range (IQR) | 2.8% | 3.1% |
| Standard Deviation (Sample) | 2.9% | 2.4% |
| Standard Deviation (Population) | 2.9% | 2.4% |
Demographics Similar to Chippewa and Kiowa by Hearing Disability
In terms of hearing disability, the demographic groups most similar to Chippewa are Cheyenne (4.0%, a difference of 0.65%), Shoshone (4.0%, a difference of 0.81%), Comanche (4.0%, a difference of 0.82%), Paiute (4.1%, a difference of 2.1%), and Seminole (4.1%, a difference of 2.3%). Similarly, the demographic groups most similar to Kiowa are Creek (4.4%, a difference of 0.71%), Aleut (4.3%, a difference of 1.3%), Dutch West Indian (4.3%, a difference of 1.9%), Houma (4.2%, a difference of 2.5%), and Cherokee (4.2%, a difference of 3.2%).
| Demographics | Rating | Rank | Hearing Disability |
| Comanche | 0.0 /100 | #317 | Tragic 4.0% |
| Cheyenne | 0.0 /100 | #318 | Tragic 4.0% |
| Chippewa | 0.0 /100 | #319 | Tragic 4.0% |
| Shoshone | 0.0 /100 | #320 | Tragic 4.0% |
| Paiute | 0.0 /100 | #321 | Tragic 4.1% |
| Seminole | 0.0 /100 | #322 | Tragic 4.1% |
| Apache | 0.0 /100 | #323 | Tragic 4.1% |
| Osage | 0.0 /100 | #324 | Tragic 4.1% |
| Lumbee | 0.0 /100 | #325 | Tragic 4.1% |
| Potawatomi | 0.0 /100 | #326 | Tragic 4.1% |
| Arapaho | 0.0 /100 | #327 | Tragic 4.1% |
| Tohono O'odham | 0.0 /100 | #328 | Tragic 4.2% |
| Crow | 0.0 /100 | #329 | Tragic 4.2% |
| Natives/Alaskans | 0.0 /100 | #330 | Tragic 4.2% |
| Cherokee | 0.0 /100 | #331 | Tragic 4.2% |
| Houma | 0.0 /100 | #332 | Tragic 4.2% |
| Dutch West Indians | 0.0 /100 | #333 | Tragic 4.3% |
| Aleuts | 0.0 /100 | #334 | Tragic 4.3% |
| Kiowa | 0.0 /100 | #335 | Tragic 4.3% |
| Creek | 0.0 /100 | #336 | Tragic 4.4% |
| Chickasaw | 0.0 /100 | #337 | Tragic 4.5% |